Fy 2013 Annual Performance Report - U.s. Department Of Labor Page 37
ADVERTISEMENT
 1
1 2
2 3
3 4
4 5
5 6
6 7
7 8
8 9
9 10
10 11
11 12
12 13
13 14
14 15
15 16
16 17
17 18
18 19
19 20
20 21
21 22
22 23
23 24
24 25
25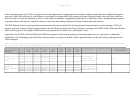 26
26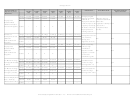 27
27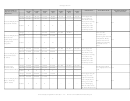 28
28 29
29 30
30 31
31 32
32 33
33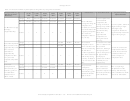 34
34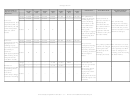 35
35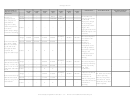 36
36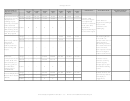 37
37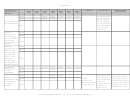 38
38 39
39 40
40 41
41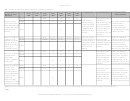 42
42 43
43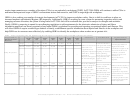 44
44 45
45 46
46 47
47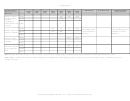 48
48 49
49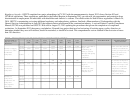 50
50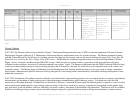 51
51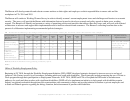 52
52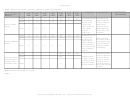 53
53 54
54 55
55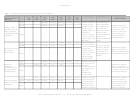 56
56 57
57 58
58 59
59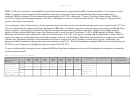 60
60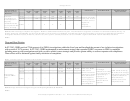 61
61 62
62 63
63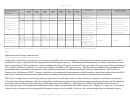 64
64 65
65 66
66 67
67 68
68 69
69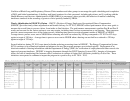 70
70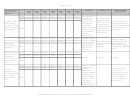 71
71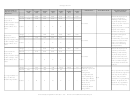 72
72 73
73 74
74 75
75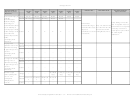 76
76 77
77 78
78 79
79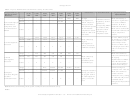 80
80 81
81 82
82 83
83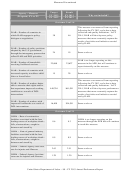 84
84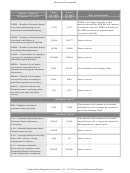 85
85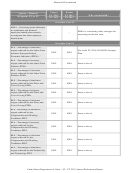 86
86 87
87 88
88 89
89Strategic Goal 1
*Target reached (Y),
What Worked
What Didn't Work
Program Performance
FY/PY
FY/PY
FY/PY
FY/PY
FY/PY
FY/PY
FY/PY
Improved (I), or Not
Improvement Plan
2009
2010
2011
2012
2013
2014
2015
Reached (N)
Percent of Job Corps
Target
75.0%
65.3%
66.3%
67.3%
65.0%
70.0%
74.0%
Participants entering
From PY 2010
Result
65.8%
73.4%
73.3%
73.3%
--
--
--
employment or
onward, our targets
In PY 2009 our
enrolling in post-
were adjusted to
targets were still high
secondary education
economic conditions.
but economic
and/or advanced
At the same time,
conditions were
training/occupational
Status
N
Y
Y
Y
--
--
--
performance
challenging.
skills training in the
improved allowing us
first quarter after exit
to exceed the targets.
from the program
Target
--
--
--
--
69.00
69.00
65.00
Job Training Match
Crosswalk was
Result
--
--
--
--
65.30
--
--
Percent of graduates
revised in PY 2011 to
placed in an
reflect narrower
occupation or
job/training matches.
industry related to
The results have been
their training (Job
Status
--
--
--
--
--
--
--
lower since then.
Corps)
OJC requests to lower
the FY 15 target to
better account for adj
Percent of
Target
--
--
52.00%
58.80%
58.50%
57.80%
57.60%
participants deficient
Grantees receive
Result
--
--
58.30%
59.11%
--
--
--
in basic skills who
intensive coaching
achieve literacy or
and TA support,
numeracy gains of
through peer to peer
Status
--
--
Y
Y
--
--
--
one adult basic
and national training
education level
events.
(YouthBuild)
Target
--
--
58.10%
58.50%
59.30%
60.60%
61.20%
Grantee receives TA
Entered Employment
around best practices
Rate for Non-Youth
Result
--
--
68.55%
58.60%
--
--
--
and employer
(ReXO)
Status
--
--
Y
Y
--
--
--
engagement.
United States Department of Labor – 33 – FY 2013 Annual Performance Report
ADVERTISEMENT
0 votes
Related Articles
Related forms


 Performance And Accountability Report - Fiscal Year 2013 - Federal Aviation Administration - U.s. Department Of Transportation
Business
Performance And Accountability Report - Fiscal Year 2013 - Federal Aviation Administration - U.s. Department Of Transportation
Business


 For The Unemployment Insurance (ui) Reemployment Rate Measure - U.s. Department Of Labor")
 - U.s. Department Of Labor - 2013")
Related Categories
Parent category: Legal