Fy 2013 Annual Performance Report - U.s. Department Of Labor Page 38
ADVERTISEMENT
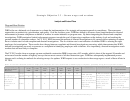
Strategic Goal 1
*Target reached (Y),
What Worked
What Didn't Work
Program Performance
FY/PY
FY/PY
FY/PY
FY/PY
FY/PY
FY/PY
FY/PY
Improved (I), or Not
Improvement Plan
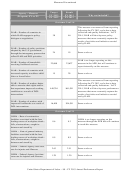
2009
2010
2011
2012
2013
2014
2015
Reached (N)
Target
--
--
22.00%
22.00%
22.00%
22.00%
22.00%
The program met this
goal, which requires
Result
--
--
12.00%
13.20%
--
--
--
grantees to be lower
Recidivism Rate for
than the established
Non-Youth (ReXO)
goal. Support around
Status
--
--
--
I
--
--
--
employer engagement
TA supports a low
recidivism rate.
Percent of
Target
--
--
--
--
--
--
--
participants who
Result
--
--
--
--
--
--
--
enter training and
receive a certificate
(Face Forward
Status
--
--
--
--
--
--
--
Grants for Juvenile
Offenders)
Percent of
Target
--
--
--
--
--
--
--
participants who are
Result
--
--
--
--
--
--
--
enrolled in high
school equivalency
preparation and
receive the State
educational
Status
--
--
--
--
--
--
--
certificate (Face
Forward Grants for
Juvenile Offenders)
Placement into
Target
--
--
41.70%
50.20%
50.00%
50.40%
50.50%
Employment or
Result
--
--
--
49.61%
--
--
--
Education
Status
--
--
--
--
--
--
--
(YouthBuild)
Target
--
--
--
59.00%
62.00%
--
--
Smaller grant cohorts
ETA continues to work
Percent of Training
(National Emergency
Result
--
--
--
57.20%
--
--
--
Workforce
towards improving APG
Program Exiters who
Grants, ARRA High
Investment Act
performance by exploring
Earn an Industry
Growth, and
(WIA) program data
the source of fluctuations
Recognized
Emerging Industries)
Status
--
--
--
--
--
--
--
has been consistent.
and refining the programs
Credential
fluctuate due to
included in the measure.
smaller cohorts.
United States Department of Labor – 34 – FY 2013 Annual Performance Report
ADVERTISEMENT
0 votes
Related Articles
Related forms
Related Categories
Parent category: Legal
 1
1 2
2 3
3 4
4 5
5 6
6 7
7 8
8 9
9 10
10 11
11 12
12 13
13 14
14 15
15 16
16 17
17 18
18 19
19 20
20 21
21 22
22 23
23 24
24 25
25 26
26 27
27 28
28 29
29 30
30 31
31 32
32 33
33 34
34 35
35 36
36 37
37 38
38 39
39 40
40 41
41 42
42 43
43 44
44 45
45 46
46 47
47 48
48 49
49 50
50 51
51 52
52 53
53 54
54 55
55 56
56 57
57 58
58 59
59 60
60 61
61 62
62 63
63 64
64 65
65 66
66 67
67 68
68 69
69 70
70 71
71 72
72 73
73 74
74 75
75 76
76 77
77 78
78 79
79 80
80 81
81 82
82 83
83 84
84 85
85 86
86 87
87 88
88 89
89


