Fy 2013 Annual Performance Report - U.s. Department Of Labor Page 84
ADVERTISEMENT
 1
1 2
2 3
3 4
4 5
5 6
6 7
7 8
8 9
9 10
10 11
11 12
12 13
13 14
14 15
15 16
16 17
17 18
18 19
19 20
20 21
21 22
22 23
23 24
24 25
25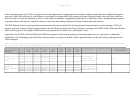 26
26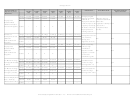 27
27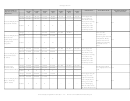 28
28 29
29 30
30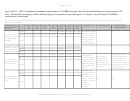 31
31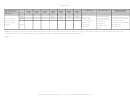 32
32 33
33 34
34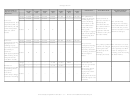 35
35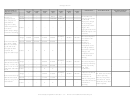 36
36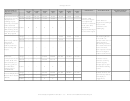 37
37 38
38 39
39 40
40 41
41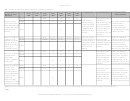 42
42 43
43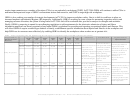 44
44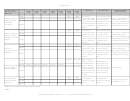 45
45 46
46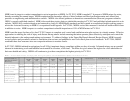 47
47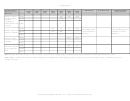 48
48 49
49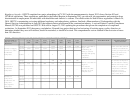 50
50 51
51 52
52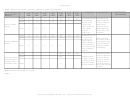 53
53 54
54 55
55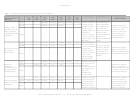 56
56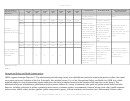 57
57 58
58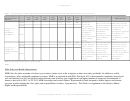 59
59 60
60 61
61 62
62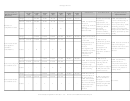 63
63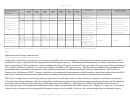 64
64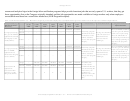 65
65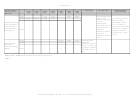 66
66 67
67 68
68 69
69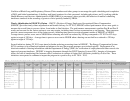 70
70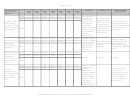 71
71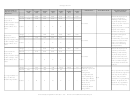 72
72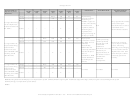 73
73 74
74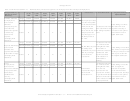 75
75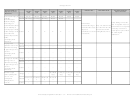 76
76 77
77 78
78 79
79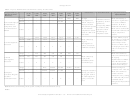 80
80 81
81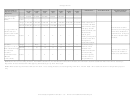 82
82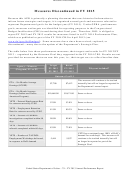 83
83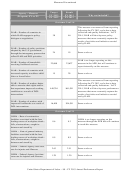 84
84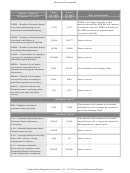 85
85 86
86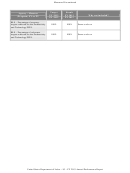 87
87 88
88 89
89Measures Discontinued
Target
Result
Agency – Measure
FY 2013
FY 2013
Why not included?
(Program) FY or PY
PY 2012
PY 2012
Outcome Goal 1.6
This measure was removed from reporting
following the FY 2013 cycle due to data
ILAB – Number of countries in
collection and quality limitations. In FY
which ILAB engages in policy
30
46
2014, ILAB will develop new policy
dialogue or negotiation.
measures that more accurately capture the
results of activities and initiatives carried
out by ILAB.
ILAB – Number of policy positions
adopted by the U.S. government
24
19
Same as above
through the interagency process that
reflect ILAB and DOL priorities
ILAB is no longer reporting on this
ILAB – Number of households
23,068
23,627
measure in the APR, but will continue to
receiving livelihood services
report internally on this measure.
ILAB – Number of countries with
increased capacity to address child
15
29
Same as above
labor or forced labor
This measure was removed from reporting
ILAB – Number of workers better
following the FY 2013 cycle due to data
able to exercise their rights and/or
collection and quality limitations. In FY
that experience improved working
448,794
861,591
2014, ILAB will develop new performance
conditions as a result of DOL
measures that more accurately capture the
interventions
results of activities and initiatives carried
out by ILAB.
ILAB – Number of workers with
improved livelihoods as a result of
16,400
304,591
Same as above
DOL interventions
Outcome Goal 2.1
OSHA – Rate of construction
fatalities associated with the four
OSHA is no longer reporting on this
leading causes of workplace death -
8.6
8.3
measure through the APR but will continue
falls, electrocutions, caught in
to track this measure.
between and struck by
OSHA – Rate of general industry
fatalities associated with the four
leading causes of workplace death -
0.9
0.9
Same as above
falls, electrocutions, caught in
between and struck by
OSHA – Federal Agency total case
2.63
2.51
Same as above
rate for injuries and illnesses
OSHA – Federal Agency lost time
1.29
1.20
Same as above
case rate for injuries and illnesses
United States Department of Labor – 80 – FY 2013 Annual Performance Report
ADVERTISEMENT
0 votes
Related Articles
Related forms


 Performance And Accountability Report - Fiscal Year 2013 - Federal Aviation Administration - U.s. Department Of Transportation
Business
Performance And Accountability Report - Fiscal Year 2013 - Federal Aviation Administration - U.s. Department Of Transportation
Business


 For The Unemployment Insurance (ui) Reemployment Rate Measure - U.s. Department Of Labor")
 - U.s. Department Of Labor - 2013")
Related Categories
Parent category: Legal