Fy 2013 Annual Performance Report - U.s. Department Of Labor Page 77
ADVERTISEMENT
 1
1 2
2 3
3 4
4 5
5 6
6 7
7 8
8 9
9 10
10 11
11 12
12 13
13 14
14 15
15 16
16 17
17 18
18 19
19 20
20 21
21 22
22 23
23 24
24 25
25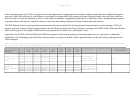 26
26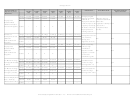 27
27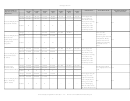 28
28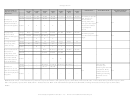 29
29 30
30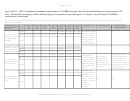 31
31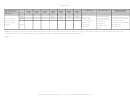 32
32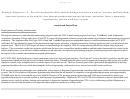 33
33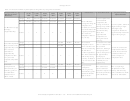 34
34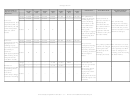 35
35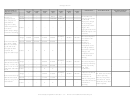 36
36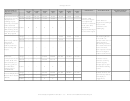 37
37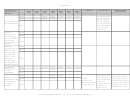 38
38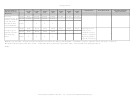 39
39 40
40 41
41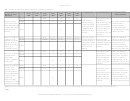 42
42 43
43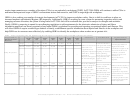 44
44 45
45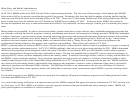 46
46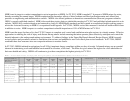 47
47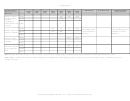 48
48 49
49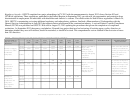 50
50 51
51 52
52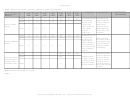 53
53 54
54 55
55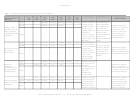 56
56 57
57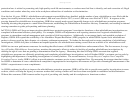 58
58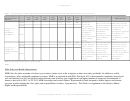 59
59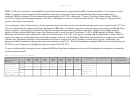 60
60 61
61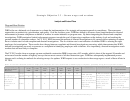 62
62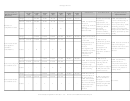 63
63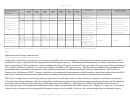 64
64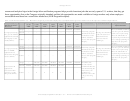 65
65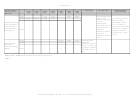 66
66 67
67 68
68 69
69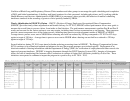 70
70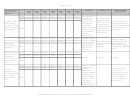 71
71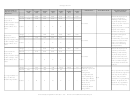 72
72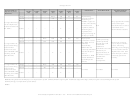 73
73 74
74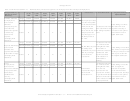 75
75 76
76 77
77 78
78 79
79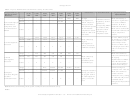 80
80 81
81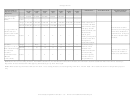 82
82 83
83 84
84 85
85 86
86 87
87 88
88 89
89Strategic Goal 4
*Target reached (Y),
What Worked
What Didn't Work
Program Performance
FY/PY
FY/PY
FY/PY
FY/PY
FY/PY
FY/PY
FY/PY
Improved (I), or Not
Improvement Plan
2009
2010
2011
2012
2013
2014
2015
Reached (N)
Number of job
Target
--
--
--
--
--
--
--
seeker participants
Result 1,674,034 1,554,702 1,416,435 1,369,207
--
--
--
served – Veterans
(Employment
Status
--
--
--
--
--
--
--
Service)
Target
87.50%
83.30%
82.90%
83.20%
83.60%
91.20%
91.20% New provisions for
Annual goals were
TAA benefits and
met or exceeded in all
Result
88.00%
86.20%
89.90%
91.00%
91.00%
--
--
Employment
services under the
years in the last five
Retention Rate
2009 and 2011
years, and exceeded
No improvement plan
(Trade Adjustment
amendments are
the goal by more than
necessary for this measure.
Assistance)
Status
Y
Y
Y
Y
Y
--
--
reflected in improved
7 percent in the two
outcomes from 2011
most recent fiscal
onward.
years.
Sources: Facilitate Claimant Reemployment: ETA 9047 report; First Payment Timeliness: ETA 9050 and 9050p reports; Detect Overpayments: Benefit Accuracy Measurement
(BAM) survey and ETA 227 report; Tax liability determinations: ETA 581 report. Trade – Trade Activity Participant Report (TAPR)
Notes: [p] Preliminary, based on UI reemployment data for the period July 2012 through June 2013, the most recent data available. [r] Revised from previously reported data. 1/
ETA will establish targets for these measures in PY 2014/FY 2015.
United States Department of Labor – 73 – FY 2013 Annual Performance Report
ADVERTISEMENT
0 votes
Related Articles
Related forms


 Performance And Accountability Report - Fiscal Year 2013 - Federal Aviation Administration - U.s. Department Of Transportation
Business
Performance And Accountability Report - Fiscal Year 2013 - Federal Aviation Administration - U.s. Department Of Transportation
Business


 For The Unemployment Insurance (ui) Reemployment Rate Measure - U.s. Department Of Labor")
 - U.s. Department Of Labor - 2013")
Related Categories
Parent category: Legal