Functions Worksheet - Big Ideas Math Prealgebra: A Florida Standards Curriculum Teaching Edition Page 11
ADVERTISEMENT
 1
1 2
2 3
3 4
4 5
5 6
6 7
7 8
8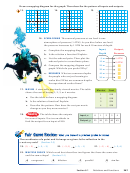 9
9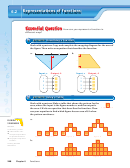 10
10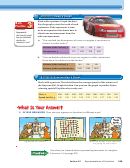 11
11 12
12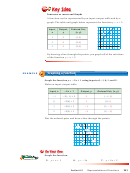 13
13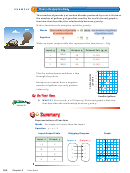 14
14 15
15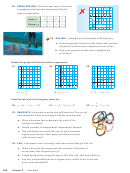 16
16 17
17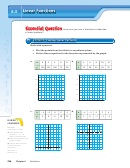 18
18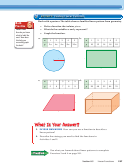 19
19 20
20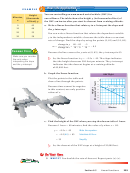 21
21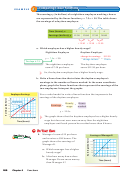 22
22 23
23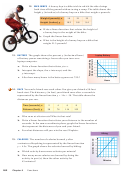 24
24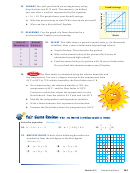 25
25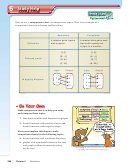 26
26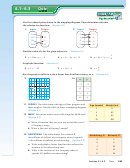 27
27 28
28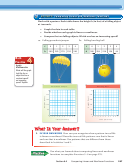 29
29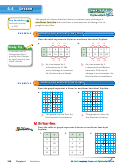 30
30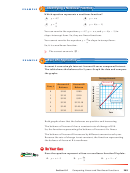 31
31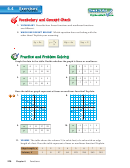 32
32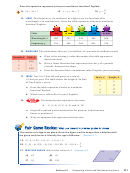 33
33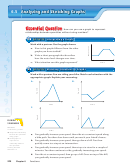 34
34 35
35 36
36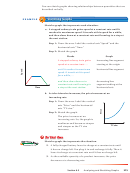 37
37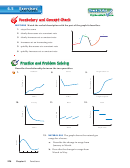 38
38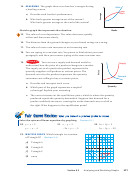 39
39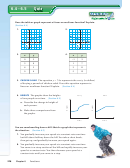 40
40 41
41 42
42 43
43 44
44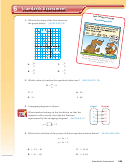 45
45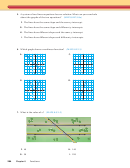 46
46 47
473 3
ACTIVITY:
Using a Graph
Work with a partner. Graph the data.
Math
Use the graph to test the truth of each
Practice
statement. If the statement is true,
Construct
write an equation that shows how to
Arguments
obtain one measurement from the
How does the graph
other measurement.
help you determine
whether the
a. “You can fi nd the horsepower of a race car engine if you know its
statement is true?
volume in cubic inches.”
Volume (cubic inches), x
200
350
350
500
Horsepower, y
375
650
250
600
b. “You can fi nd the volume of a race car engine in cubic centimeters
if you know its volume in cubic inches.”
Volume (cubic inches), x
100
200
300
Volume (cubic centimeters), y
1640
3280
4920
4 4
ACTIVITY:
Interpreting a Graph
Work with a partner. The table shows the average speeds of the winners of
the Daytona 500. Graph the data. Can you use the graph to predict future
winning speeds? Explain why or why not.
Year, x
2004 2005 2006 2007 2008 2009 2010 2011 2012
Speed (mi/h), y
156
135
143
149
153
133
137
130
140
IN YOUR OWN WORDS
5.
How can you represent a function in different ways?
“I graphed our profits.”
“And I am happy to say that they
are going up every day!”
Use what you learned about representing functions to complete
Exercises 4 –6 on page 253.
Section 6.2
Representations of Functions
249
ADVERTISEMENT
0 votes
Related Articles
Related forms


Related Categories
Parent category: Education