Functions Worksheet - Big Ideas Math Prealgebra: A Florida Standards Curriculum Teaching Edition Page 37
ADVERTISEMENT
 1
1 2
2 3
3 4
4 5
5 6
6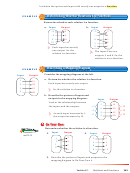 7
7 8
8 9
9 10
10 11
11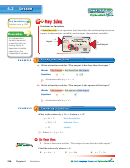 12
12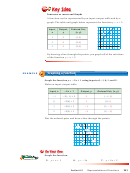 13
13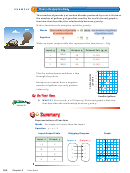 14
14 15
15 16
16 17
17 18
18 19
19 20
20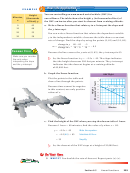 21
21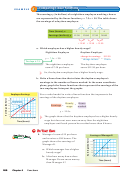 22
22 23
23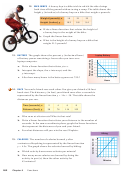 24
24 25
25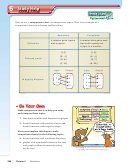 26
26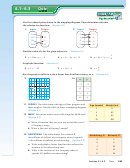 27
27 28
28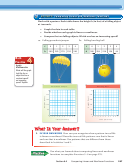 29
29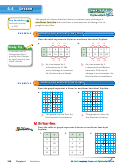 30
30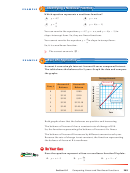 31
31 32
32 33
33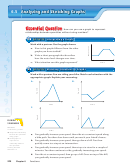 34
34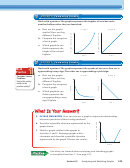 35
35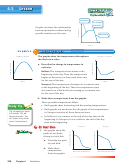 36
36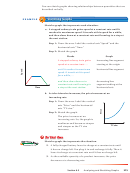 37
37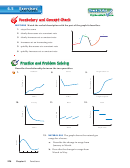 38
38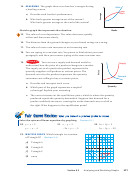 39
39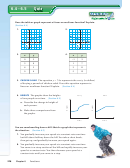 40
40 41
41 42
42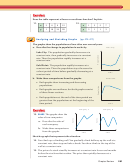 43
43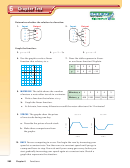 44
44 45
45 46
46 47
47You can sketch graphs showing relationships between quantities that are
described verbally.
2 2
Sketching Graphs
EXAMPLE
Sketch a graph that represents each situation.
a. A stopped subway train gains speed at a constant rate until it
reaches its maximum speed. It travels at this speed for a while,
and then slows down at a constant rate until coming to a stop at
the next station.
Step 1: Draw the axes. Label the vertical axis “Speed” and the
horizontal axis “Time.”
Step 2: Sketch the graph.
Words
Graph
A stopped subway train gains
increasing line segment
speed at a constant rate . . .
starting at the origin
horizontal line segment
until it reaches its maximum
speed. It travels at this speed
for a while, . . .
and then slows down at a
decreasing line
constant rate until coming to
segment ending at the
a stop at the next station.
horizontal axis
Time
b. As television size increases, the price increases at an
increasing rate.
Step 1: Draw the axes. Label the vertical
axis “Price” and the horizontal
axis “TV size.”
Step 2: Sketch the graph.
The price increases at an
increasing rate. So, the graph is
nonlinear and becomes steeper
TV size
and steeper as the TV size
increases.
Sketch a graph that represents the situation.
Exercises 15–18
2. A fully charged battery loses its charge at a constant rate until
it has no charge left. You plug it in and recharge it fully. Then it
loses its charge at a constant rate until it has no charge left.
3. As the available quantity of a product increases, the price
decreases at a decreasing rate.
Section 6.5
Analyzing and Sketching Graphs
275
ADVERTISEMENT
0 votes
Related Articles
Related forms


Related Categories
Parent category: Education