Functions Worksheet - Big Ideas Math Prealgebra: A Florida Standards Curriculum Teaching Edition Page 36
ADVERTISEMENT
 1
1 2
2 3
3 4
4 5
5 6
6 7
7 8
8 9
9 10
10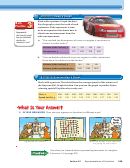 11
11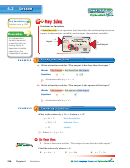 12
12 13
13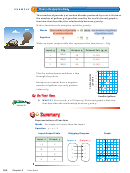 14
14 15
15 16
16 17
17 18
18 19
19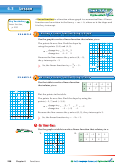 20
20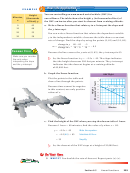 21
21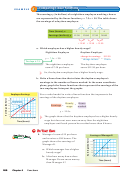 22
22 23
23 24
24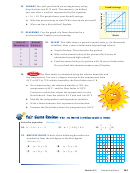 25
25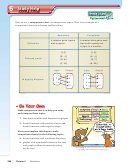 26
26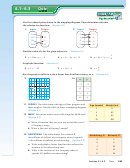 27
27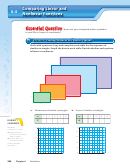 28
28 29
29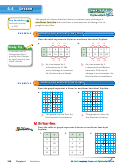 30
30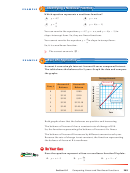 31
31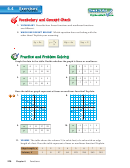 32
32 33
33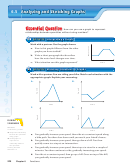 34
34 35
35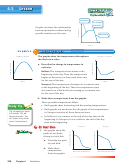 36
36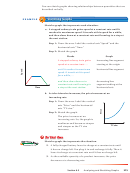 37
37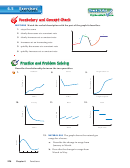 38
38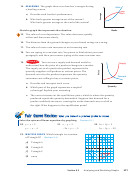 39
39 40
40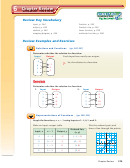 41
41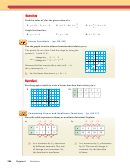 42
42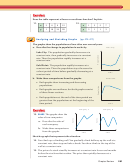 43
43 44
44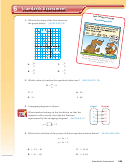 45
45 46
46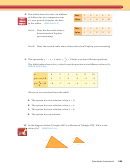 47
47Lesson
6.5
Lesson Tutorials
increasing
no change
(constant)
Graphs can show the relationship
between quantities without using
specifi c numbers on the axes.
decreasing
Time
1 1
Analyzing Graphs
EXAMPLE
The graphs show the temperatures throughout
Belfast, Maine
Newport, Oregon
the day in two cities.
a. Describe the change in temperature in
each city.
Belfast: The temperature increases at the
beginning of the day. Then the temperature
begins to decrease at a faster and faster rate
for the rest of the day.
Time
Time
Newport: The temperature decreases at a constant rate
at the beginning of the day. Then the temperature stays
the same for a while before increasing at a constant rate
for the rest of the day.
b. Make three comparisons from the graphs.
Three possible comparisons follow:
Both graphs show increasing and decreasing temperatures.
Study Tip
●
Both graphs are nonlinear, but the graph of the temperatures
●
The comparisons given
in Newport consists of three linear sections.
in Example 1(b) are
In Belfast, it was warmer at the end of the day than at the
sample answers. You
●
can make many other
beginning. In Newport, it was colder at the end of the day
correct comparisons.
than at the beginning.
Pelican
Osprey
1. The graphs show the
paths of two birds
Exercises 7–12
diving to catch fi sh.
a. Describe the path
of each bird.
b. Make three
comparisons
Horizontal distance
Horizontal distance
from the graphs.
274
Chapter 6
Functions
ADVERTISEMENT
0 votes
Related Articles
Related forms


Related Categories
Parent category: Education