Functions Worksheet - Big Ideas Math Prealgebra: A Florida Standards Curriculum Teaching Edition Page 39
ADVERTISEMENT
 1
1 2
2 3
3 4
4 5
5 6
6 7
7 8
8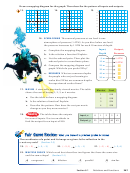 9
9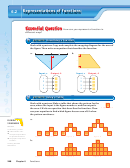 10
10 11
11 12
12 13
13 14
14 15
15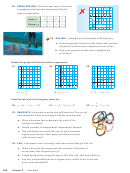 16
16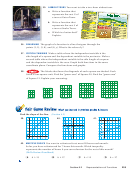 17
17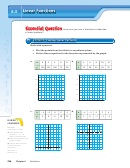 18
18 19
19 20
20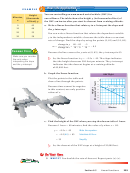 21
21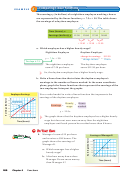 22
22 23
23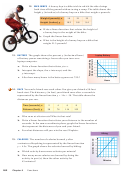 24
24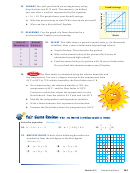 25
25 26
26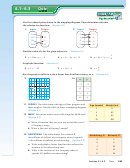 27
27 28
28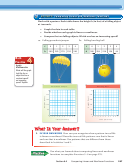 29
29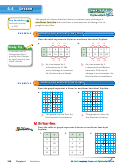 30
30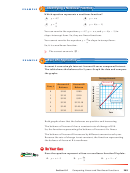 31
31 32
32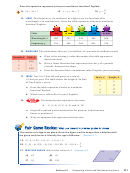 33
33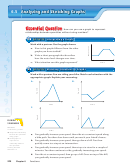 34
34 35
35 36
36 37
37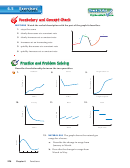 38
38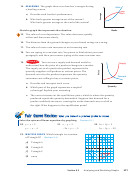 39
39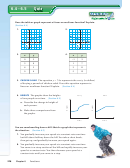 40
40 41
41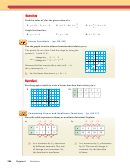 42
42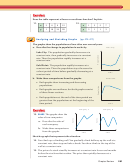 43
43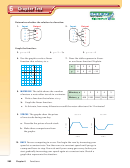 44
44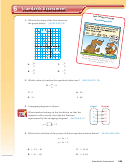 45
45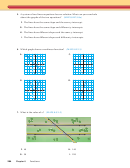 46
46 47
4714.
REASONING
The graph shows two bowlers’ averages during
Mike
a bowling season.
Mark
a. Describe each bowler’s performance.
b. Who had a greater average most of the season?
Who had a greater average at the end of the season?
Sketch a graph that represents the situation.
Weeks
2
2
15. The value of a car depreciates. The value decreases quickly
at fi rst and then more slowly.
16. The distance from the ground changes as your friend swings on a swing.
17. The value of a rare coin increases at an increasing rate.
18. You are typing at a constant rate. You pause to think about your next
paragraph, and then you resume typing at the same constant rate.
Economics
Economics
19.
You can use a supply and demand model to
Supply
understand how the price of a product changes in a market.
The supply curve of a particular product represents the
quantity suppliers will produce at various prices. The
demand curve for the product represents the quantity
Demand
consumers are willing to buy at various prices.
a. Describe and interpret each curve.
Quantity
b. Which part of the graph represents a surplus?
a shortage? Explain your reasoning.
c. The curves intersect at the equilibrium point, which is where the quantity
produced equals the quantity demanded. Suppose that demand for a
product suddenly increases, causing the entire demand curve to shift to
the right. What happens to the equilibrium point?
Solve the system of linear equations by graphing.
(Section 5.1)
20. y = x + 2
21. x − y = 3
22. 3x + 2y = 2
y = − x − 4
− 2x + y = − 5
5x − 3y = − 22
23.
MULTIPLE CHOICE
Which triangle is a rotation
y
4
of Triangle D?
(Section 2.4)
A
3
B
2
○
Triangle A
A
1
○
Triangle B
B
4
3
2
1
1
2
3
4
x
○
Triangle C
C
C
2
D
3
○
none
D
4
Section 6.5
Analyzing and Sketching Graphs
277
ADVERTISEMENT
0 votes
Related Articles
Related forms


Related Categories
Parent category: Education