Functions Worksheet - Big Ideas Math Prealgebra: A Florida Standards Curriculum Teaching Edition Page 29
ADVERTISEMENT
 1
1 2
2 3
3 4
4 5
5 6
6 7
7 8
8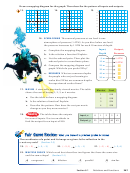 9
9 10
10 11
11 12
12 13
13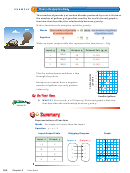 14
14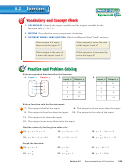 15
15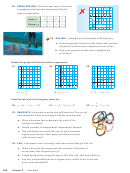 16
16 17
17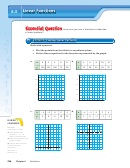 18
18 19
19 20
20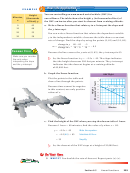 21
21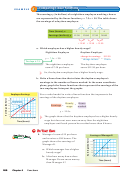 22
22 23
23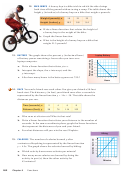 24
24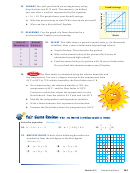 25
25 26
26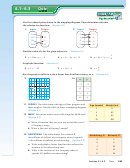 27
27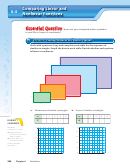 28
28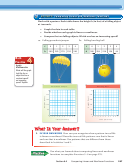 29
29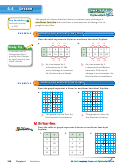 30
30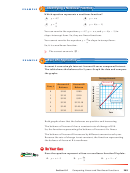 31
31 32
32 33
33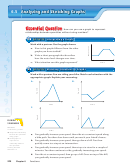 34
34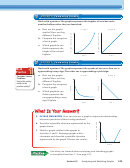 35
35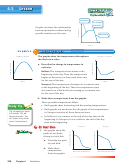 36
36 37
37 38
38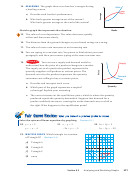 39
39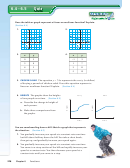 40
40 41
41 42
42 43
43 44
44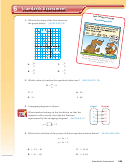 45
45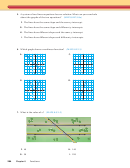 46
46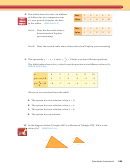 47
472 2
ACTIVITY:
Comparing Linear and Nonlinear Functions
Work with a partner. Each table shows the height h (in feet) of a falling object
at t seconds.
Graph the data in each table.
●
Decide whether each graph is linear or nonlinear.
●
Compare the two falling objects. Which one has an increasing speed?
●
a. Falling parachute jumper
b. Falling bowling ball
t
0
1
2
3
4
t
0
1
2
3
4
h
h
300
285
270
255
240
300
284
236
156
44
Math
Practice
Apply
Mathematics
What will the graph
look like for an
object that has a
constant speed?
an increasing
speed? Explain.
Bowling Ball
Parachute Jumper
h
h
240
240
180
180
120
120
60
60
0
0
0
1
2
3
4
5
6
7
8 9
t
0
1
2
3
4
5
6
7
8
9
t
Time (seconds)
Time (seconds)
3.
IN YOUR OWN WORDS
How can you recognize when a pattern in real life
is linear or nonlinear? Describe two real-life patterns: one that is linear
and one that is nonlinear. Use patterns that are different from those
described in Activities 1 and 2.
Use what you learned about comparing linear and nonlinear
functions to complete Exercises 3 – 6 on page 270.
Section 6.4
Comparing Linear and Nonlinear Functions
267
ADVERTISEMENT
0 votes
Related Articles
Related forms


Related Categories
Parent category: Education