Functions Worksheet - Big Ideas Math Prealgebra: A Florida Standards Curriculum Teaching Edition Page 40
ADVERTISEMENT
 1
1 2
2 3
3 4
4 5
5 6
6 7
7 8
8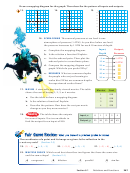 9
9 10
10 11
11 12
12 13
13 14
14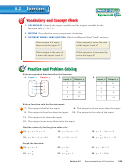 15
15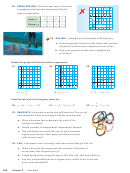 16
16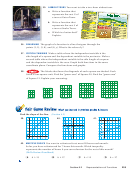 17
17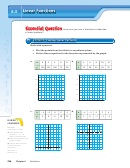 18
18 19
19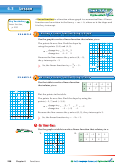 20
20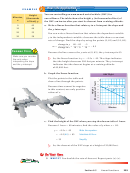 21
21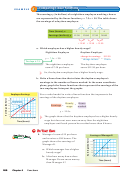 22
22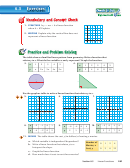 23
23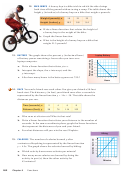 24
24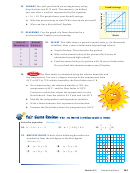 25
25 26
26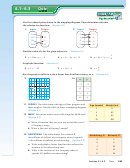 27
27 28
28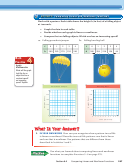 29
29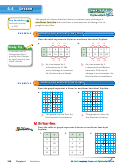 30
30 31
31 32
32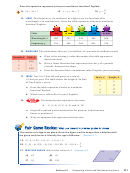 33
33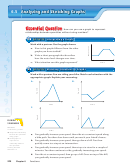 34
34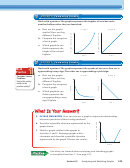 35
35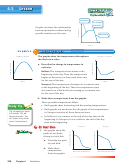 36
36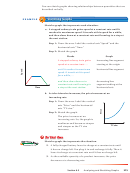 37
37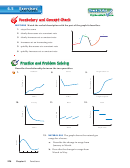 38
38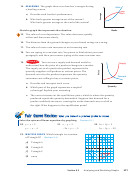 39
39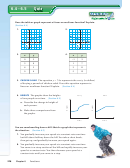 40
40 41
41 42
42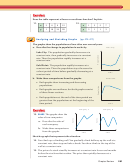 43
43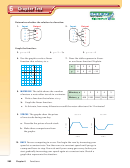 44
44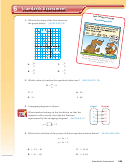 45
45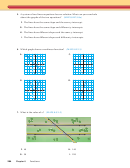 46
46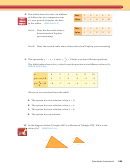 47
47Quiz
6.4 – 6.5
Progress Check
Does the table or graph represent a linear or nonlinear function? Explain.
(Section 6.4)
1.
2.
y
y
4
4
3
3
2
2
1
x
2
1
1
2
3
4
x
3
2
1
1
2
3
1
1
2
2
3.
4.
x
y
x
y
− 1
0
3
3
3
0
1
7
6
3
3
11
9
6
5
15
The equation y = 7.9x represents the cost y (in dollars)
5.
CHICKEN SALAD
of buying x pounds of chicken salad. Does this equation represent a
linear or nonlinear function? Explain.
(Section 6.4)
6.
HEIGHTS
The graphs show the heights
Larry
Phil
of two people over time.
(Section 6.5)
a. Describe the change in height of
each person.
b. Make three comparisons from
the graphs.
Time
Time
You are snowboarding down a hill. Sketch a graph that represents
the situation.
(Section 6.5)
7. You gradually increase your speed at a constant rate over time
but fall about halfway down the hill. You take a short break,
then get up, and gradually increase your speed again.
8. You gradually increase your speed at a constant rate over time.
You come to a steep section of the hill and rapidly increase your
speed at a constant rate. You then decrease your speed at a
constant rate until you come to a stop.
278
Chapter 6
Functions
ADVERTISEMENT
0 votes
Related Articles
Related forms


Related Categories
Parent category: Education