Functions Worksheet - Big Ideas Math Prealgebra: A Florida Standards Curriculum Teaching Edition Page 30
ADVERTISEMENT
 1
1 2
2 3
3 4
4 5
5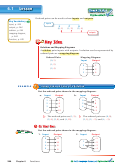 6
6 7
7 8
8 9
9 10
10 11
11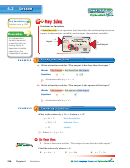 12
12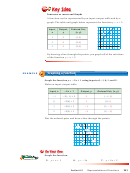 13
13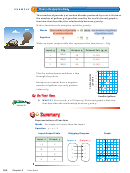 14
14 15
15 16
16 17
17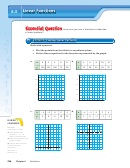 18
18 19
19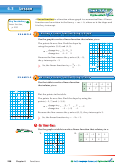 20
20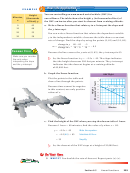 21
21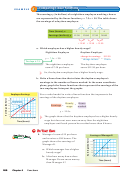 22
22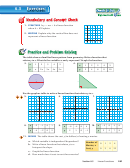 23
23 24
24 25
25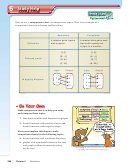 26
26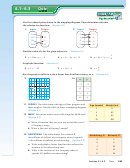 27
27 28
28 29
29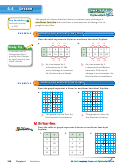 30
30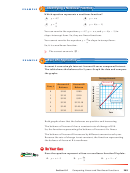 31
31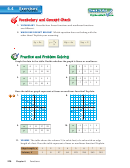 32
32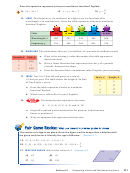 33
33 34
34 35
35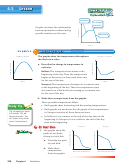 36
36 37
37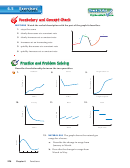 38
38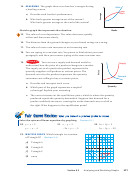 39
39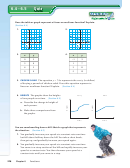 40
40 41
41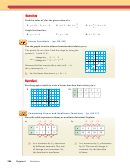 42
42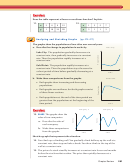 43
43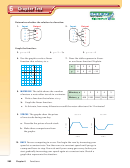 44
44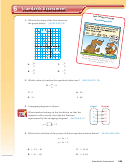 45
45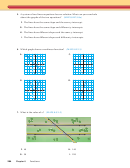 46
46 47
47Lesson
6.4
Lesson Tutorials
The graph of a linear function shows a constant rate of change. A
Key Vocabulary
nonlinear function does not have a constant rate of change. So, its
nonlinear function,
graph is not a line.
p. 268
1 1
Identifying Functions from Tables
EXAMPLE
Does the table represent a linear or nonlinear function? Explain.
a.
+3
+3
+3
b.
+2
+2
+2
Study Tip
x
3
6
9
12
x
1
3
5
7
A constant rate of
y
40
32
24
16
change describes a
y
2
11
33
88
quantity that changes
by equal amounts over
−8
−8
−8
+9
+22 +55
equal intervals.
As x increases by 3,
As x increases by 2,
y decreases by 8. The
y increases by different
rate of change is constant.
amounts. The rate of
So, the function is linear.
change is not constant. So,
the function is nonlinear.
2 2
Identifying Functions from Graphs
EXAMPLE
Does the graph represent a linear or nonlinear function? Explain.
y
a.
b.
y
3
3
2
2
1
1
3
2
1
1
2
3
x
3
2
1
2
3
x
1
1
2
3
3
The graph is not a line. So,
The graph is a line. So,
the function is nonlinear.
the function is linear.
Does the table or graph represent a linear or nonlinear function?
Explain.
Exercises 7–10
1.
2.
3.
y
x
y
x
y
3
2
8
2
0
25
4
4
7
20
3
2
1
2
3
x
1
6
0
2
14
15
3
−4
8
21
10
268
Chapter 6
Functions
ADVERTISEMENT
0 votes
Related Articles
Related forms


Related Categories
Parent category: Education