Functions Worksheet - Big Ideas Math Prealgebra: A Florida Standards Curriculum Teaching Edition Page 5
ADVERTISEMENT
 1
1 2
2 3
3 4
4 5
5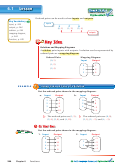 6
6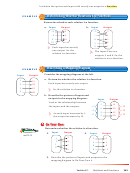 7
7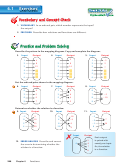 8
8 9
9 10
10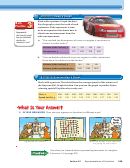 11
11 12
12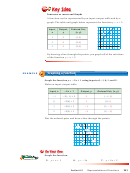 13
13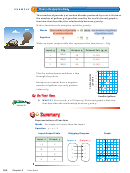 14
14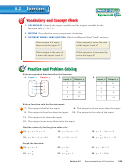 15
15 16
16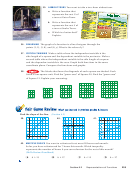 17
17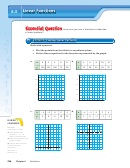 18
18 19
19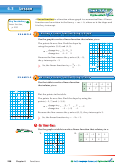 20
20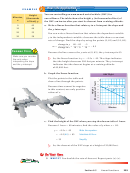 21
21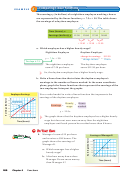 22
22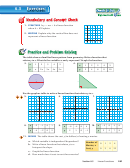 23
23 24
24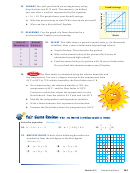 25
25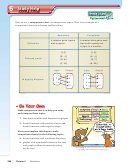 26
26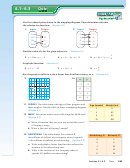 27
27 28
28 29
29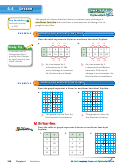 30
30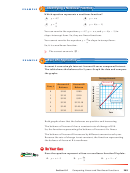 31
31 32
32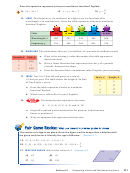 33
33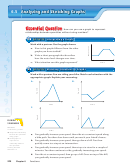 34
34 35
35 36
36 37
37 38
38 39
39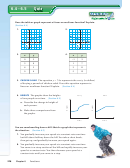 40
40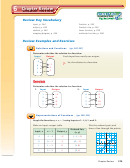 41
41 42
42 43
43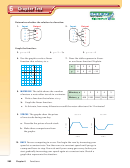 44
44 45
45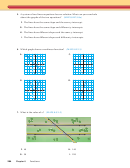 46
46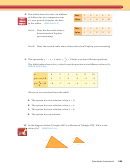 47
472 2
ACTIVITY:
Describing Situations
Math
Work with a partner. How many outputs are assigned to each input? Describe
Practice
a possible situation for each mapping diagram.
View as
Input, x
Output, y
Input, x
Output, y
a.
b.
Components
What are the input
12
0
6
10
values? Do any of
23
13
1
11
the input values
point to more than
15
30
2
12
one output value?
48
20
3
13
How does this help
you describe a
possible situation?
3
ACTIVITY:
Interpreting Mapping Diagrams
Work with a partner. Describe the pattern in the mapping diagram. Copy
and complete the diagram.
Input, t
Output, M
a.
b.
Input, x
Output, A
1
8
1
4/3
2
10
2
5/3
3
12
3
2
4
4
5
5
6
6
7
7
4.
IN YOUR OWN WORDS
How can you use a mapping diagram to show the
relationship between two data sets?
“It shows how I feel about my
“I made a mapping diagram.”
skateboard with each passing day.”
Use what you learned about mapping diagrams to complete
Exercises 3–5 on page 246.
Section 6.1
Relations and Functions
243
ADVERTISEMENT
0 votes
Related Articles
Related forms


Related Categories
Parent category: Education