Functions Worksheet - Big Ideas Math Prealgebra: A Florida Standards Curriculum Teaching Edition Page 13
ADVERTISEMENT
 1
1 2
2 3
3 4
4 5
5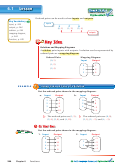 6
6 7
7 8
8 9
9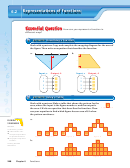 10
10 11
11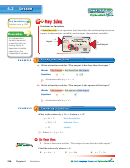 12
12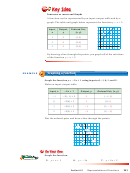 13
13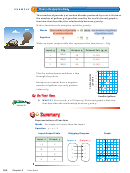 14
14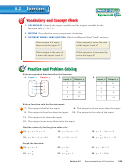 15
15 16
16 17
17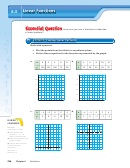 18
18 19
19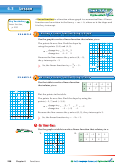 20
20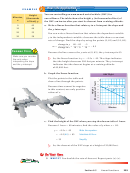 21
21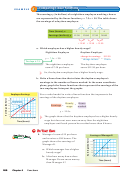 22
22 23
23 24
24 25
25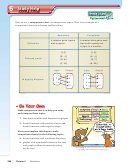 26
26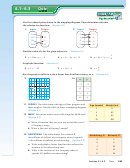 27
27 28
28 29
29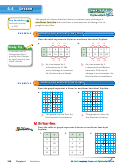 30
30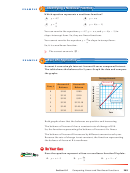 31
31 32
32 33
33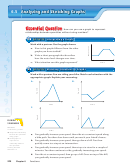 34
34 35
35 36
36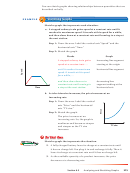 37
37 38
38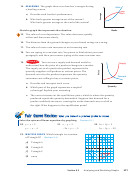 39
39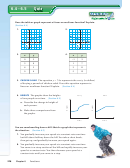 40
40 41
41 42
42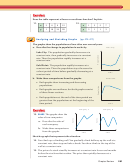 43
43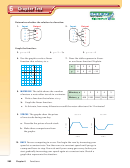 44
44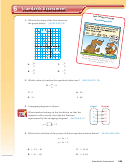 45
45 46
46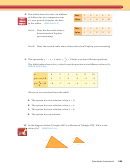 47
47Functions as Tables and Graphs
A function can be represented by an input-output table and by a
graph. The table and graph below represent the function y = x + 2.
y
Input,
Output,
Ordered Pair,
6
x
y
(x, y)
5
(2, 4)
(3, 5)
4
1
3
(1, 3)
3
(1, 3)
2
4
(2, 4)
1
3
5
(3, 5)
1
2
3
4
5
6
x
By drawing a line through the points, you graph all of the solutions
of the function y = x + 2.
3 3
Graphing a Function
EXAMPLE
Graph the function y = −2x + 1 using inputs of −1, 0, 1, and 2.
Make an input-output table.
−2 x + 1
Input, x
Output, y
Ordered Pair, ( x, y)
− 1
−
1) + 1
2(−
(−
1, 3)
3
− 2(0) + 1
1
(0, 1)
0
− 2(1) + 1
− 1
−
1
(1,
1)
− 2(2) + 1
− 3
−
2
(2,
3)
Plot the ordered pairs and draw a line through the points.
y
3
( 1, 3)
(0, 1)
1
(1,
1)
3
2
1
2
3
4
x
2
(2,
3)
3
Graph the function.
Exercises 19 –24
5. y = x + 1
6. y = − 3x
7. y = 3x + 2
Section 6.2
Representations of Functions
251
ADVERTISEMENT
0 votes
Related Articles
Related forms


Related Categories
Parent category: Education