Functions Worksheet - Big Ideas Math Prealgebra: A Florida Standards Curriculum Teaching Edition Page 35
ADVERTISEMENT
 1
1 2
2 3
3 4
4 5
5 6
6 7
7 8
8 9
9 10
10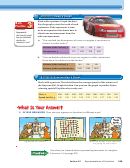 11
11 12
12 13
13 14
14 15
15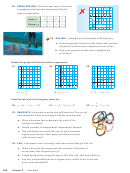 16
16 17
17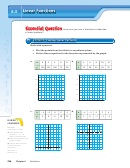 18
18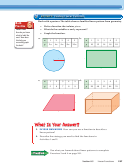 19
19 20
20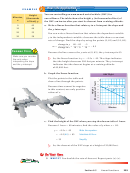 21
21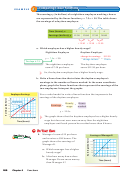 22
22 23
23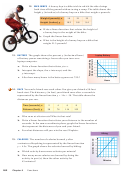 24
24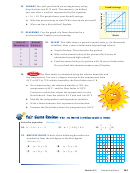 25
25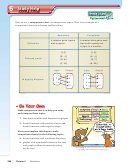 26
26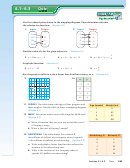 27
27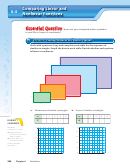 28
28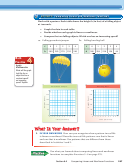 29
29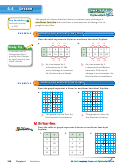 30
30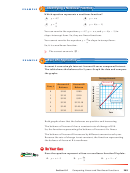 31
31 32
32 33
33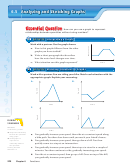 34
34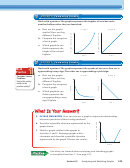 35
35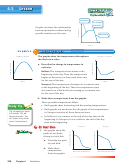 36
36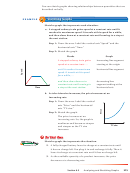 37
37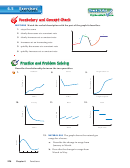 38
38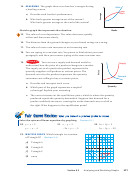 39
39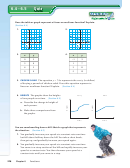 40
40 41
41 42
42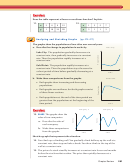 43
43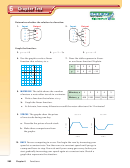 44
44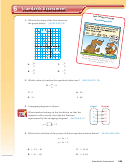 45
45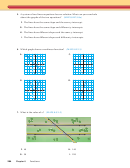 46
46 47
473 3
ACTIVITY:
Comparing Graphs
Work with a partner. The graphs represent the heights of a rocket and a
weather balloon after they are launched.
a. How are the graphs
Graph A
Graph B
similar? How are they
different? Explain.
b. Compare the steepness
of each graph.
c. Which graph do you
think represents the
height of the rocket?
Explain.
Time
Time
4 4
ACTIVITY:
Comparing Graphs
Work with a partner. The graphs represent the speeds of two cars. One car is
Math
approaching a stop sign. The other car is approaching a yield sign.
Practice
a. How are the graphs
Consider Similar
Graph A
Graph B
similar? How are they
Problems
different? Explain.
How is this activity
similar to the
b. Compare the steepness
previous activity?
of each graph.
c. Which graph do you
think represents the
car approaching a stop
sign? Explain.
Time
Time
IN YOUR OWN WORDS
How can you use a graph to represent relationships
5.
between quantities without using numbers?
6. Describe a possible situation represented by the
graph shown.
7. Sketch a graph similar to the graphs in
Activities 1 and 2. Exchange graphs with a
classmate and describe a possible situation
represented by the graph. Discuss the results.
Time
Use what you learned about analyzing and sketching graphs
to complete Exercises 7 – 9 on page 276.
Section 6.5
Analyzing and Sketching Graphs
273
ADVERTISEMENT
0 votes
Related Articles
Related forms


Related Categories
Parent category: Education