Functions Worksheet - Big Ideas Math Prealgebra: A Florida Standards Curriculum Teaching Edition Page 42
ADVERTISEMENT
 1
1 2
2 3
3 4
4 5
5 6
6 7
7 8
8 9
9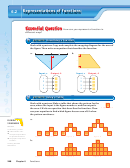 10
10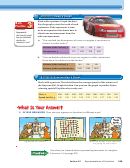 11
11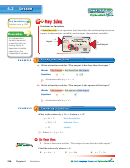 12
12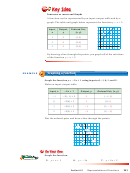 13
13 14
14 15
15 16
16 17
17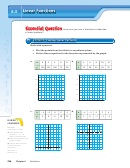 18
18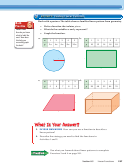 19
19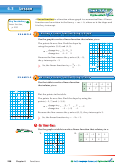 20
20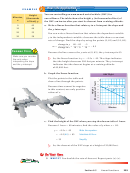 21
21 22
22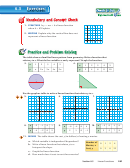 23
23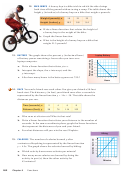 24
24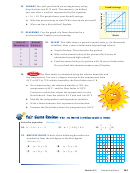 25
25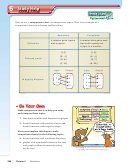 26
26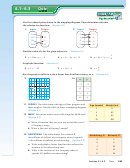 27
27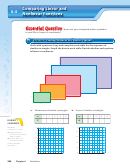 28
28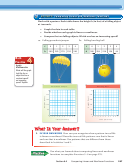 29
29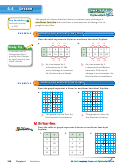 30
30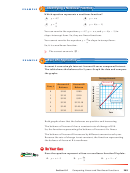 31
31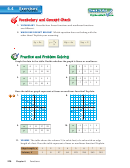 32
32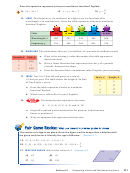 33
33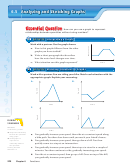 34
34 35
35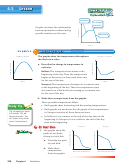 36
36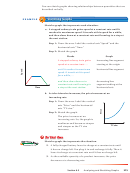 37
37 38
38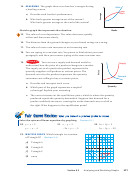 39
39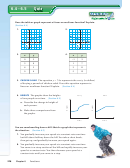 40
40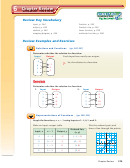 41
41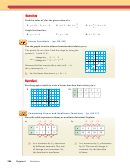 42
42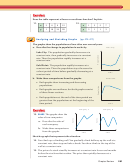 43
43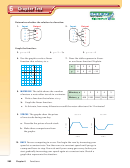 44
44 45
45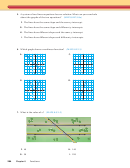 46
46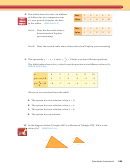 47
47Find the value of y for the given value of x.
2
x
3. y = 2x − 3; x = − 4
4. y = 2 − 9x; x =
5. y =
+ 5; x = 6
—
—
3
3
Graph the function.
6. y = x + 3
7. y = − 5x
8. y = 3 − 3x
6.3
6.3
Linear Functions
(pp. 256–263)
Use the graph to write a linear function that relates y to x.
The points lie on a line. Find the slope by using the
y
(2, 3)
points (1, 1) and (2, 3).
3
2
3 − 1
(1, 1)
change in y
2
m =
=
=
= 2
—
—
—
1
2 − 1
change in x
1
3
2
1
1
2
3
x
Because the line crosses the y-axis at (0, −1),
(0, 1)
2
the y-intercept is −1.
( 1, 3)
So, the linear function is y = 2x − 1.
Use the graph or table to write a linear function that relates y to x.
9.
10.
y
−2
x
0
2
4
4
3
−7
−7
−7
−7
y
2
1
6
5
4
3
2
1
1
2
3
x
1
6.4
6.4
Comparing Linear and Nonlinear Functions
(pp. 266–271)
Does the table represent a linear or nonlinear function? Explain.
+2
+2
+2
+5
+5
+5
a.
b.
x
0
2
4
6
x
0
5
10
15
y
0
1
4
9
y
50
40
30
20
+1
+3
+5
− 10 − 10 − 10
As x increases by 2, y increases
As x increases by 5, y decreases
by different amounts. The rate
by 10. The rate of change is
of change is not constant. So,
constant. So, the function
the function is nonlinear.
is linear.
280
Chapter 6
Functions
ADVERTISEMENT
0 votes
Related Articles
Related forms


Related Categories
Parent category: Education