A Designer As Brand - Personal Fashion Business Plan As A Sample For Fashion Entrepreneurs Page 24
ADVERTISEMENT
 1
1 2
2 3
3 4
4 5
5 6
6 7
7 8
8 9
9 10
10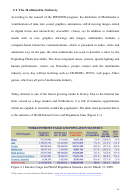 11
11 12
12 13
13 14
14 15
15 16
16 17
17 18
18 19
19 20
20 21
21 22
22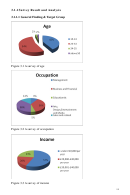 23
23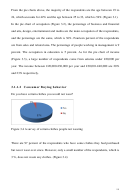 24
24 25
25 26
26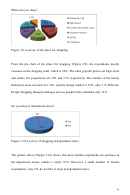 27
27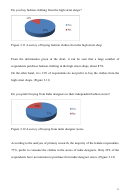 28
28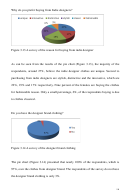 29
29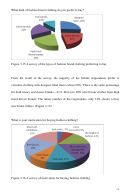 30
30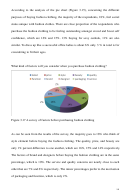 31
31 32
32 33
33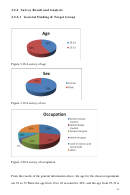 34
34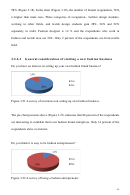 35
35 36
36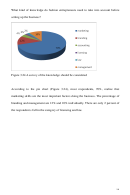 37
37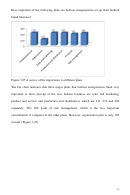 38
38 39
39 40
40 41
41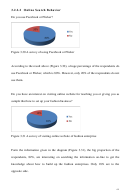 42
42 43
43 44
44 45
45 46
46 47
47 48
48 49
49 50
50 51
51 52
52 53
53 54
54 55
55 56
56 57
57 58
58 59
59 60
60 61
61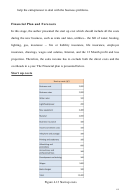 62
62 63
63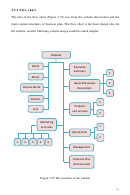 64
64 65
65 66
66 67
67 68
68 69
69 70
70 71
71 72
72 73
73 74
74 75
75 76
76 77
77 78
78From the pie charts above, the majority of the respondents are the age between 19 to
24, which accounts for 42% and the age between 25 to 33, which is 54% (Figure 3.1).
In the pie chart of occupation (Figure 3.2), the percentage of business and financial
and arts, design, entertainment and media are the main occupation of the respondents,
and the percentage are the same, which is 36%. Fourteen percent of the respondents
are from sales and related area. The percentage of people working in management is 9
percent. The occupation in education is 5 percent. As for the pie chart of income
(Figure 3.3), a large number of respondents come from salaries under £20,000 per
year. The income between £20,000-£30,000 per year and £30,001-£40,000 are 20%
and 23% respectively.
3.1.1.2 Consumer Buying behavior
Do you have certain clothes you would not wear?
Figure 3.4 A survey of certain clothes people not wearing
There are 97 percent of the respondents who have some clothes they had purchased
but never wear ever since. However, only a small number of the respondents, which is
3 %, does not waste any clothes. (Figure 3.4)
23
ADVERTISEMENT
0 votes
Related Articles
Related forms


")


Related Categories
Parent category: Business