Small Farm Business Planning Templates And Instrucitons Page 27
ADVERTISEMENT
 1
1 2
2 3
3 4
4 5
5 6
6 7
7 8
8 9
9 10
10 11
11 12
12 13
13 14
14 15
15 16
16 17
17 18
18 19
19 20
20 21
21 22
22 23
23 24
24 25
25 26
26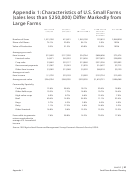 27
27 28
28 29
29 30
30 31
31 32
32 33
33 34
34 35
35 36
36 37
37 38
38 39
39 40
40 41
41 42
42 43
43 44
44 45
45 46
46 47
47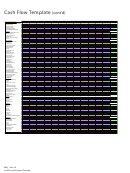 48
48 49
49 50
50Appendix 1: Characteristics of U.S. Small Farms
(sales less than $250,000) Differ Markedly from
Large Farms
LESS THAN
$50,000-
ALL
FARMS WITH
ALL FARMS
$50,000
$249,999
SMALL FARMS
SALES OF
$250,000
OR MORE
Number of farms
1,531,760
413,431
1,945,190
122,810
2,068,000
Share of all farms
74.1%
20.0%
94.1%
5.9%
100%
Value of Production
9.5%
31.3%
40.8%
59.2%
100%
Average gross cash
farm income
$12,482
$117,320
$34,764
$686,606
$73,474
Livestock sales
$4,671
$45,910
$13,436
$272,625
$28,828
Crop sales
$3,662
$52,117
$13,960
$331,236
$32,802
Government payments
$1,067
$5,343
$1,976
$14,427
$2,715
Other farm income
$3,082
$13,948
$5,392
$68,318
$9,129
Average net cash
farm income
$-1,702
$23,159
$3,582
$152,724
$12,439
Average asset value
$264,784
$569,295
$329,505
$1,618,751
$406,068
Commodity Specialty
Cash grain
12.6%
38.4%
18.1%
30.4%
18.8%
Other field crops
19.3%
7.7%
16.8%
10.7%
16.4%
High-value crops
6.0%
8.7%
6.6%
13.4%
7.0%
Beef
40.4%
14.0%
34.0%
11.1%
33.4%
Hogs
3.7%
4.2%
3.8%
6.5%
4.0%
Dairy
1.1%
17.5%
4.6%
14.6%
5.2%
Other livestock
16.8%
9.6%
15.3%
13.3%
15.2%
Farms able to generate
7.6%
38.8%
14.2%
70.5%
17.6%
returns equivalent to
average U.S. household
income
Source: 1995 Agricultural Resources Management Survey. Economic Research Service, USDA.
Unit 2.0 | 27
Appendix 1
Small Farm Business Planning
ADVERTISEMENT
0 votes
Related Articles
Related forms


Related Categories
Parent category: Business