Dividends And Stock Valuation: A Study From The Nineteenth To The Twenty-First Century Page 16
ADVERTISEMENT
 1
1 2
2 3
3 4
4 5
5 6
6 7
7 8
8 9
9 10
10 11
11 12
12 13
13 14
14 15
15 16
16 17
17 18
18 19
19 20
20 21
21 22
22 23
23 24
24 25
25 26
26 27
27 28
28 29
29 30
30 31
31 32
32 33
33 34
34 35
35 36
36 37
37 38
38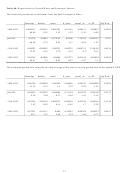 39
39 40
40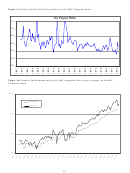 41
41 42
42 43
43 44
44 45
45where y
is either r
, r*
, g
or g*
representing the estimated cost of equity, implied cost of equity,
t
t
t
t
t
estimated growth rate and actual growth rate of dividends respectively.
4. Data
Our main data series is the aggregate S&P Composite Index data obtained from Robert Shiller’s
website (
). These data include information on the price of the index
as well as the annual dividend payments and earnings for each year back to 1871. We chose this series
because the Standard & Poor’s Composite Index (S&P stocks) is the most commonly used benchmark
portfolio. Before 1957, this index covered 90 companies; since March 1957, it has covered 500. The S&P
Index is a market-value weighted index designed to provide a benchmark for total U.S. equity market
4
performance
.
For the other factors we consider, the data on interest rates and stock market returns are from the
Global Financial Database (details on the sources from which they obtained the data are available at
). The factors that we consider are the U.S. 10-year government
bond yields, the AAA corporate bond rates and the total market returns for the U.S. We supplement this
with information on the PE Ratio and inflation in the U.S. also obtained from Shiller. For the historical
data on the nominal U.S. GNP we use data from the U.S. Department of Commerce and U.S. Bureau of
Economic Analysis.
5. Results
5.1 Preliminary Investigation
4
Naturally there are several issues with such a long historical data series. There have been documented concerns
associated with the S&P data before 1926. Specifically, Standard and Poor's does not publish dividend or earnings
series before 1926 so most studies use information from the Cowles Report (Cowles (1939)) to supplement the S&P
data. An issue is that Cowles does not have earnings data for many of the stocks in the Standard and Poor Index.
The absence of earnings data for some stocks may influence the accuracy of the earnings series with the largest
discrepancies occurring in the earliest years of the sample. Wilson and Jones (1987) examine the Cowles data for
accuracy and find some apparent errors in the earnings and dividend series but they conclude that the overall impact
should be minimal.
14
ADVERTISEMENT
0 votes
Related Articles
Related forms


 - Twenty-first Century Scholars Program Credit - 2014")


 From The Department Of Veterans Affairs")


Related Categories
Parent category: Business