Dividends And Stock Valuation: A Study From The Nineteenth To The Twenty-First Century Page 38
ADVERTISEMENT
 1
1 2
2 3
3 4
4 5
5 6
6 7
7 8
8 9
9 10
10 11
11 12
12 13
13 14
14 15
15 16
16 17
17 18
18 19
19 20
20 21
21 22
22 23
23 24
24 25
25 26
26 27
27 28
28 29
29 30
30 31
31 32
32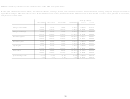 33
33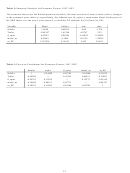 34
34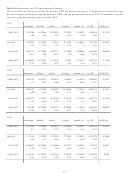 35
35 36
36 37
37 38
38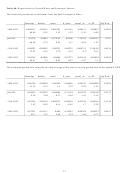 39
39 40
40 41
41 42
42 43
43 44
44 45
45Table 8a: Regressions for the costs of equity and growth rates
Regressions for Estimated and Implied Costs of Equity with Economic Factors.
The level of the implied cost of equity for the S&P Composite Index obtained using the DDM.
Intercept
defulev
tsulev
d_cpius
mom5_us
us_PE
adj R-sq
1886-1992
0.00208
0.00564
0.0013
0.03842
0.00507
0.000439
0.545
50.83
2.29
9.23
3.76
3.65
-2.12
pre1914
0.06974
-0.01686
0.000971
0.11644
-0.00136
0.001
0.4991
28.14
-3.51
0.75
2.03
-0.33
2.64
1914-1945
0.1006
-0.03123
0.00371
0.04084
0.000146
-0.00014
0.4792
47.11
-2.8
1.68
1.19
0.03
-0.25
1945-1992
0.12754
0.03322
0.00879
0.13079
0.02441
-0.00138
0.5121
49.98
5.08
3.44
1.81
2.38
-2.35
The level of the implied cost of equity for the S&P Composite Index obtained using the GGM with the
growth rate being estimated using the year-over-year growth in the nominal GNP.
Intercept
defulev
tsulev
d_cpius
mom5_us
us_PE
adj R-sq
1886-1992
0.00113
0.00307
0.000711
0.02094
0.00276
0.000239
0.4176
77.66
1.01
1.85
2.72
4.5
-5.57
pre1914
0.08017
0.00177
-0.00037
0.15299
0.0025
-0.00013
0.0886
22.83
0.26
-0.2
1.88
0.43
-0.24
1914-1945
0.08948
-0.00897
-0.00323
0.09438
0.00957
0.000198
0.4167
47.56
-0.91
-1.66
3.12
2.27
0.41
1945-1992
0.09093
0.00236
0.00284
0.03587
0.01341
-0.00231
0.5918
67.76
0.69
2.12
0.95
2.49
-7.46
36
ADVERTISEMENT
0 votes
Related Articles
Related forms


 - Twenty-first Century Scholars Program Credit - 2014")


 From The Department Of Veterans Affairs")


Related Categories
Parent category: Business