Dividends And Stock Valuation: A Study From The Nineteenth To The Twenty-First Century Page 44
ADVERTISEMENT
 1
1 2
2 3
3 4
4 5
5 6
6 7
7 8
8 9
9 10
10 11
11 12
12 13
13 14
14 15
15 16
16 17
17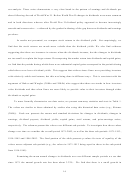 18
18 19
19 20
20 21
21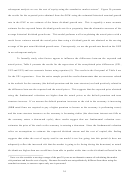 22
22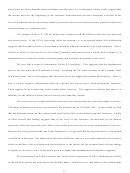 23
23 24
24 25
25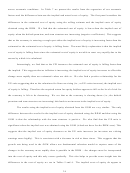 26
26 27
27 28
28 29
29 30
30 31
31 32
32 33
33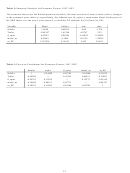 34
34 35
35 36
36 37
37 38
38 39
39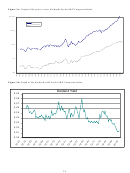 40
40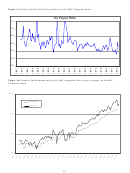 41
41 42
42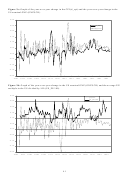 43
43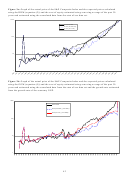 44
44 45
45Figure 3a: Graph of the actual price of the S&P Composite Index and the expected prices calculated
using the DDM (equation (2)) and the cost of equity estimated using a moving average of the past 30
years and estimated using the cumulated data from the start of our data set.
1000
Actual Price
Price (ke MA30)
Price (ke cum)
100
10
1
Figure 3b: Graph of the actual price of the S&P Composite Index and the expected prices calculated
using the GGM (equation (5)) and the cost of equity estimated using a moving average of the past 30
years and estimated using the cumulated data from the start of our data set and the growth rate estimated
from the growth rate of the economy GNP.
1000
Actual Price
Price (ke MA30, g cum GNP)
Price (ke cum, g cum GNP)
100
10
1
42
ADVERTISEMENT
0 votes
Related Articles
Related forms


 - Twenty-first Century Scholars Program Credit - 2014")


 From The Department Of Veterans Affairs")


Related Categories
Parent category: Business