Dividends And Stock Valuation: A Study From The Nineteenth To The Twenty-First Century Page 20
ADVERTISEMENT
 1
1 2
2 3
3 4
4 5
5 6
6 7
7 8
8 9
9 10
10 11
11 12
12 13
13 14
14 15
15 16
16 17
17 18
18 19
19 20
20 21
21 22
22 23
23 24
24 25
25 26
26 27
27 28
28 29
29 30
30 31
31 32
32 33
33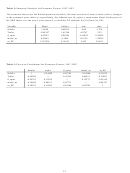 34
34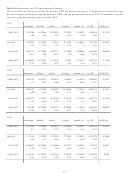 35
35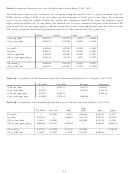 36
36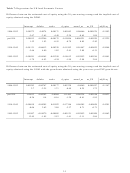 37
37 38
38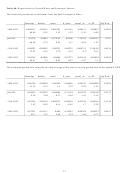 39
39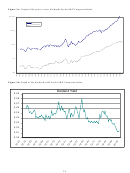 40
40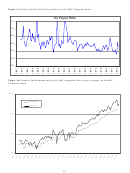 41
41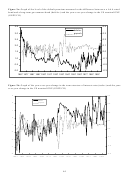 42
42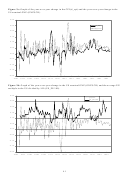 43
43 44
44 45
45This ratio, somewhat surprisingly, has remained relatively stable across our sub-periods. We see that it
declines between periods 1 and 2 then increases between periods 2 and 3. It is interesting to see that the
average P/E ratio is similar in sub-periods 1 and 3, but the volatility is much higher in period 3. This is
likely due to the rapid increase in the P/E ratios in the latter part of the third period.
These results suggest that there are definite trends in the dividend payout policies over time and
thus we reject hypothesis 1 of no differences in these series over time. There is an especially noteworthy
break in the patterns before and after World War II. If investors do value dividends and thus the payout
ratio is an important measure of the return being provided to investors, we would expect to see changes in
how investors value these firms in the periods before and after World War II.
Since much of our analysis investigates the role played by economic conditions in how investors
value equity, Figure 2 characterizes our economic factors over our sample period. In each graph we
compare each of the factors to the year-over-year changes in the U.S. nominal GNP to allow us to study
the relationships between the changes in each factor and the state of the economy. The default premium
in Figure 2a gradually decreases over the latter part of the nineteenth century as the U.S. economy was
gradually strengthening and becoming the center of global trade. To study how the default premium
changes around downturns in the U.S. economy, we look at how it changes around the start of World War
I, the Great Depression, the oil crisis in the early 1970s and the recessions in the 1980s and 1990s. The
default premium appears to increase at the start of each of these major economic downturns. The term
structure, on the other hand, appears to decrease before the economic downturns begin and therefore the
tern structure appears to lead the changes in the default premium around these events (comparing Figures
2a and 2b). After the initial decline in the term structure following the start of the economic downturn,
we see that the term structure gradually starts to increase until the economy has recovered. For the
changes in CPI in Figure 2c we see increases in inflation precede the economic downturns. Finally in
Figure 2d we see that the P/E multiples appear to increase as the economy improves and fall as it
contracts.
18
ADVERTISEMENT
0 votes
Related Articles
Related forms


 - Twenty-first Century Scholars Program Credit - 2014")


 From The Department Of Veterans Affairs")


Related Categories
Parent category: Business