Dividends And Stock Valuation: A Study From The Nineteenth To The Twenty-First Century Page 21
ADVERTISEMENT
 1
1 2
2 3
3 4
4 5
5 6
6 7
7 8
8 9
9 10
10 11
11 12
12 13
13 14
14 15
15 16
16 17
17 18
18 19
19 20
20 21
21 22
22 23
23 24
24 25
25 26
26 27
27 28
28 29
29 30
30 31
31 32
32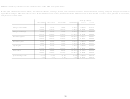 33
33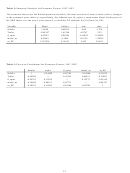 34
34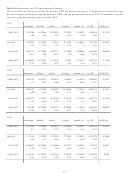 35
35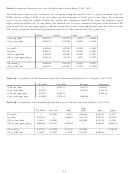 36
36 37
37 38
38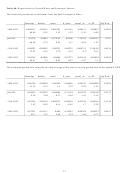 39
39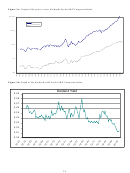 40
40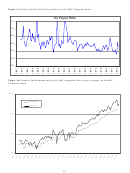 41
41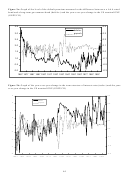 42
42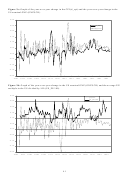 43
43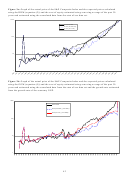 44
44 45
45We extend the graphical analysis by considering the summary statistics for our variables in Table
2. The results in this table illustrate the large variation within each of these factors over our sample
period. This significant variation allows us to use these factors to try to explain our valuations. Table 3
presents the correlations between our factors.
Interestingly, we find that the default premium is
negatively correlated with the term structure. Since the default premium and term structure are both
believed to increase as the economic risk increases, this result suggests that these factors may react to
changes in economic conditions at different rates, consistent with our graphical results. As discussed
earlier it appears that the changes in the term structure (default premium) lead (follow) the changes in the
economy as measured by the GNP. The changes in the level of the CPI, on the other hand, appear to
closely follow the economy – falling as GNP falls and rising as GNP rises.
5.2 The Dividend Discount Models
In this section we investigate the ability of valuation techniques using expected future dividends
to determine the actual value of the S&P Composite Index. The analyses in the previous section suggest a
possible relationship between dividends and prices, so we now explicitly investigate the role of expected
future dividends in determining how investors determine share prices. If dividends are valued by
investors, we should be able to use expected dividends to determine the current value of equities. We do
this using the DDM. Since we have a long series of dividends, we have an ideal situation within which to
test how well this model works in practice. We employ two forms of this model: a model which
discounts each of the future expected dividends as in equation (2), and a model which assumes a constant
growth rate to determine the future expected dividends, as in equation (5), the GGM.
Before formally examining the prices estimated by each model, Figure 3a illustrates how the expected
prices obtained from the DDM perform at explaining the actual prices over our sample. We can see that
the DDM appears to perform reasonably well at estimating the true prices over the sample regardless of
the methodology used to estimate the cost of equity. It does appear that the expected prices calculated
using the cost of equity estimated using the cumulative returns performs slightly better in general. In the
19
ADVERTISEMENT
0 votes
Related Articles
Related forms


 - Twenty-first Century Scholars Program Credit - 2014")


 From The Department Of Veterans Affairs")


Related Categories
Parent category: Business