Dividends And Stock Valuation: A Study From The Nineteenth To The Twenty-First Century Page 25
ADVERTISEMENT
 1
1 2
2 3
3 4
4 5
5 6
6 7
7 8
8 9
9 10
10 11
11 12
12 13
13 14
14 15
15 16
16 17
17 18
18 19
19 20
20 21
21 22
22 23
23 24
24 25
25 26
26 27
27 28
28 29
29 30
30 31
31 32
32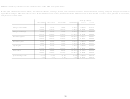 33
33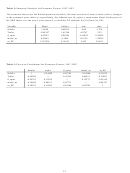 34
34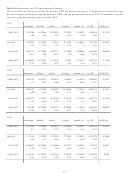 35
35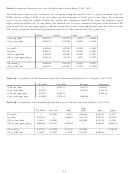 36
36 37
37 38
38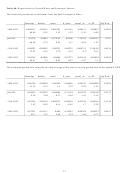 39
39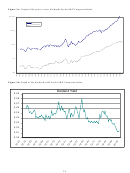 40
40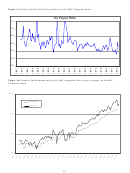 41
41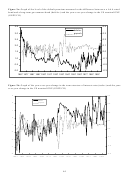 42
42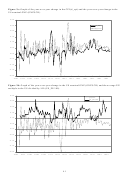 43
43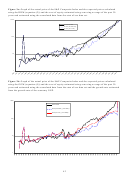 44
44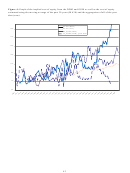 45
45This is consistent with our historical measures not adequately incorporating people’s expectations – they
are backward looking and thus not necessarily capturing investors’ current expectations regarding the
future. Although caution must be exercised in interpreting the implied cost of equity from 1980 onward
due to the short time period being used, it does suggest that investors were incorporating an increasingly
large equity premium into prices over this period.
This could be due to potentially unrealistic
expectations for how equity prices would be increasing going forward (this is consistent with the results
from Welch (2000) who finds that investors have unrealistically high expectations regarding the equity
premium).
Tables 5 and 6 present descriptive statistics for the estimated and implied costs of equity as well
as the actual and estimated growth rates. In Table 5 we see that the differences between the actual and
estimated costs of equity can be substantial over time with an average difference of roughly 0.7% for the
moving average estimation and almost 2% for cumulative estimation. In Figure 4 we see that much of
this difference stems from the cost of equity estimated using the moving average being consistently
higher than the cumulative technique especially in the latter period and this comparing more favorably
with the implied cost of equity. Interestingly, the implied cost of equity using the DDM is much higher
than that from the GGM with the growth rate estimated using the GNP. The actual growth rate in
dividends is much smoother than the growth rate estimated using the GNP though the two have very
similar overall averages of 4.3% and 4.7% respectively over the entire period. Table 6 presents the pair-
wise correlations for these measures. We find significant correlations in the differences between the
estimated and implied costs of equity in Table 6a. This is consistent with the observed similarities in
these measures. Not surprisingly the correlations between the estimated and implied costs of equity in
Table 6b are very high, especially among the estimated costs. It is interesting to note that the implied
costs of equity for the DDM and GGM models are not as highly correlated with the estimated values as
they are with each other.
Although these statistics suggest very strong relationships between the estimated and implied
costs of equity over the entire sample period, we investigate how these values change over time and
23
ADVERTISEMENT
0 votes
Related Articles
Related forms


 - Twenty-first Century Scholars Program Credit - 2014")


 From The Department Of Veterans Affairs")


Related Categories
Parent category: Business