Dividends And Stock Valuation: A Study From The Nineteenth To The Twenty-First Century Page 17
ADVERTISEMENT
 1
1 2
2 3
3 4
4 5
5 6
6 7
7 8
8 9
9 10
10 11
11 12
12 13
13 14
14 15
15 16
16 17
17 18
18 19
19 20
20 21
21 22
22 23
23 24
24 25
25 26
26 27
27 28
28 29
29 30
30 31
31 32
32 33
33 34
34 35
35 36
36 37
37 38
38 39
39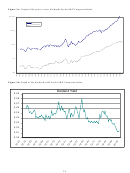 40
40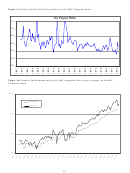 41
41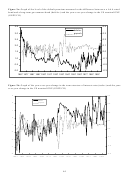 42
42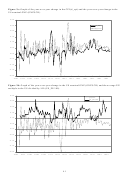 43
43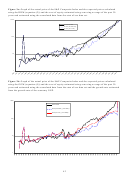 44
44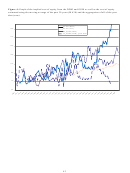 45
45If dividends are valued by investors as hypothesized in our discounted cashflow based models
(equations (2) and (4)), we should find a relationship between changes in the levels of dividends and the
current value of the Index. Examining how the prices and dividends change over our sample period
(Figure 1a) we see the dividends and prices move in a similar manner. As a result, it is not unreasonable
for us to assume that the dividend discount model, or versions of it, may describe how investors value
equity.
Looking more carefully at dividend payments, we see that the dividend yield over the entire period
is, on average, about 4.5%, but there are several trends over time (Figure 1b). The yields were higher
over the initial part of the sample decreasing during the poor economic times in the late 1800s, increasing
as the economy improved in the early part of the 1900s, decreasing again around the Great Depression
and increasing after World War II. Since 1955 the dividend yields have been decreasing, especially since
the early 1980s. This is consistent with the findings in Fama and French (2000) who assert that dividends
have decreased in importance over time.
The dividend payout ratios in Figure 1c also demonstrate some interesting changes after World War
II. We see that the payout ratios were consistently above 60% until the early 1970's, after which they
seem to have become both less volatile and lower. This suggests that dividend policies have changed
significantly over time, especially since the end of World War II given the decline in the volatility of
payout ratios since that time. It appears that managers are much more focused on maintaining a stable
dividend payout ratio since that time. Since the return to investors depends on the payout ratio, we expect
changes in the payout ratio to impact the valuation attached to equity.
Figure 1d compares the level of dividends per share to the earnings per share. The series move
closely together with earnings appearing to be more volatile and leading dividends. Not surprisingly
earnings are the most volatile between about 1916 and 1942 with very large earnings declines in 1921 and
the early 1930s. There is a clear covariation between dividends and earnings before World War II, but the
dividend series becomes much smoother, both in absolute terms and relative to earnings, after World War
II. These results provide part of the motivation for our definition of the three sub-periods we consider in
15
ADVERTISEMENT
0 votes
Related Articles
Related forms


 - Twenty-first Century Scholars Program Credit - 2014")


 From The Department Of Veterans Affairs")


Related Categories
Parent category: Business