Dividends And Stock Valuation: A Study From The Nineteenth To The Twenty-First Century Page 35
ADVERTISEMENT
 1
1 2
2 3
3 4
4 5
5 6
6 7
7 8
8 9
9 10
10 11
11 12
12 13
13 14
14 15
15 16
16 17
17 18
18 19
19 20
20 21
21 22
22 23
23 24
24 25
25 26
26 27
27 28
28 29
29 30
30 31
31 32
32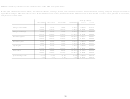 33
33 34
34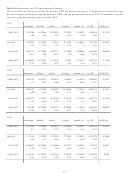 35
35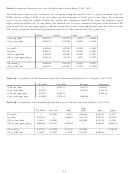 36
36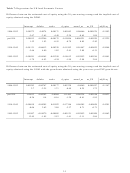 37
37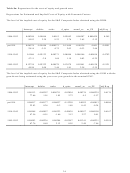 38
38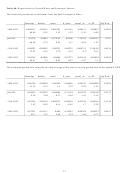 39
39 40
40 41
41 42
42 43
43 44
44 45
45Table 4: Regressions for UPI and Economic Factors
The regressions are based on model (9) and the UPIs are defined as earlier. The prices are estimated using
the cost of equity estimated using the rolling CAPM and the growth rate for the GGM is estimated using the
year-over-year growth rate of the nominal GNP.
UP1
Intercept
Defulev
tsulev
d_cpius
mom5_us
us_PE
adj R-sq
1886-1992
0.33286
0.83946
0.23856
6.74782
0.90307
0.08034
0.1518
2.83
3.49
2.01
-1.82
-1.58
-1.76
pre1914
3.00352
4.76781
1.33336
-47.1623
-3.68965
-0.4749
0.2951
2.97
2.14
1.36
-1.34
-1
-1.56
1914-1945
0.47257
-1.12856
-0.03737
1.33894
-0.94069
-0.01963
0.4068
4.57
-2.08
-0.35
0.8
-4.06
-0.74
1945-1992
-0.06895
0.37801
0.12839
1.8343
0.14157
-0.05714
0.7104
-2.27
4.86
4.22
2.14
1.16
-8.17
UP2
Intercept
defulev
tsulev
d_cpius
mom5_us
us_PE
adj R-sq
1886-1992
0.07643
0.19276
0.05478
1.54945
0.20736
0.01845
0.2161
1.71
4.69
-0.44
0.78
-0.85
-1.33
pre1914
0.82547
1.89198
0.54078
24.96466
-0.74734
-0.08112
0.4151
4.28
4.45
2.89
3.71
-1.06
-1.4
1914-1945
0.06578
-0.5837
-0.18703
2.35625
-0.31122
-0.00773
0.5786
1.47
-2.49
-4.03
3.26
-3.1
-0.67
1945-1992
-0.4145
0.07989
0.05714
0.29284
0.12534
-0.03695
0.6662
-22.96
1.73
3.16
0.57
1.73
-8.89
UP3
Intercept
defulev
tsulev
d_cpius
mom5_us
us_PE
adj R-sq
1886-1992
0.31301
0.7894
0.22434
6.34545
0.84922
0.07554
0.1127
2.6
2.57
2.25
-2.13
-1.47
-1.55
pre1914
2.17805
2.87583
0.79258
-72.1269
-2.94231
-0.39378
0.2864
2.29
1.37
0.86
-2.17
-0.85
-1.38
1914-1945
0.40678
-0.54486
0.14966
-1.01732
-0.62947
-0.0119
0.4057
4.38
-1.12
1.56
-0.68
-3.03
-0.5
1945-1992
0.34556
0.29812
0.07125
1.54146
0.01623
-0.02019
0.499
13.81
4.65
2.85
2.18
0.16
-3.5
33
ADVERTISEMENT
0 votes
Related Articles
Related forms


 - Twenty-first Century Scholars Program Credit - 2014")


 From The Department Of Veterans Affairs")


Related Categories
Parent category: Business