Dividends And Stock Valuation: A Study From The Nineteenth To The Twenty-First Century Page 24
ADVERTISEMENT
 1
1 2
2 3
3 4
4 5
5 6
6 7
7 8
8 9
9 10
10 11
11 12
12 13
13 14
14 15
15 16
16 17
17 18
18 19
19 20
20 21
21 22
22 23
23 24
24 25
25 26
26 27
27 28
28 29
29 30
30 31
31 32
32 33
33 34
34 35
35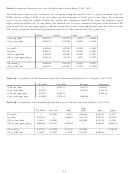 36
36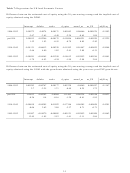 37
37 38
38 39
39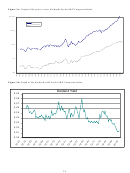 40
40 41
41 42
42 43
43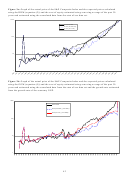 44
44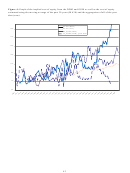 45
45are the same as those for UP1. The only difference is a lower level of statistical significance. We even
find similar patterns in the results for the second sub-period where the relationships between UP2 and the
default premium and term premium are negative. As a consequence it appears that using either the DDM
or the GGM, the pricing errors are related to similar issues and economic conditions.
The final panels in Table 4 are for UP3. The results using UP3 are designed to capture
differences in how the growth rate is estimated across models. If UP1 > UP2 we have a positive value for
UP3. We find that E
[P1] > E
[P2] when the default premium and term structure are increasing. This
t
t
suggests that our estimate for the growth rate is too low when the economy is entering an economic
contraction. This type of over-reaction to bad news should not be surprising, especially since it is
unlikely that investors could have estimated how well markets would perform over the entire sample. We
find similar results for the changes in the CPI and the P/E multiples.
Overall these results suggest that there are relationships between the differences in the expected
and actual prices that are related to changing economic conditions. Consequently these commonly used
factors do play an important role in asset pricing, even when we use a different methodology than has
been used in most of the existing literature. Unfortunately, we cannot clearly identify the source of the
differences between the actual and expected prices. The differences can generally be attributed to either a
change in the actual price or a change in the expected price. In the next section we investigate the role of
some of the assumptions we make when implementing the fundamental valuation models and how they
may be influencing these results.
5.3 The Implied versus Estimated Cost of Equity
We examine the differences between our estimated cost of equity and the imputed cost of equity
that equates the actual and theoretical values. In Figure 4 we see how the imputed costs of equity
obtained from the perfect foresight DDM and the GGM are related to the cost of equity obtained by using
the cumulative history of equity returns and the CAPM. The imputed cost of equity is lower than the
historically obtained cost during periods of economic uncertainty than in periods of economic expansion.
22
ADVERTISEMENT
0 votes
Related Articles
Related forms


 - Twenty-first Century Scholars Program Credit - 2014")


 From The Department Of Veterans Affairs")


Related Categories
Parent category: Business