Dividends And Stock Valuation: A Study From The Nineteenth To The Twenty-First Century Page 43
ADVERTISEMENT
 1
1 2
2 3
3 4
4 5
5 6
6 7
7 8
8 9
9 10
10 11
11 12
12 13
13 14
14 15
15 16
16 17
17 18
18 19
19 20
20 21
21 22
22 23
23 24
24 25
25 26
26 27
27 28
28 29
29 30
30 31
31 32
32 33
33 34
34 35
35 36
36 37
37 38
38 39
39 40
40 41
41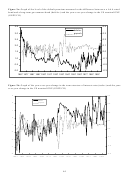 42
42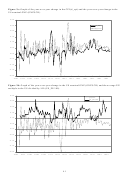 43
43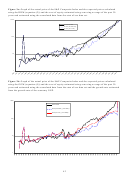 44
44 45
45Figure 2c: Graph of the year-over-year change in the CPI (d_cpi) and the year-over-year change in the
US nominal GNP (GNPUCH)
0.30
0.25
D_CPI
gnpuch
0.20
0.15
0.10
0.05
0.00
-0.05
-0.10
-0.15
-0.20
1867
1877
1887
1897
1907
1917
1927
1937
1947
1957
1967
1977
1987
1997
Figure 2d: Graph of the year-over-year change in the US nominal GNP (GNPUCH) and the average P/E
multiple in the US divided by 100 (US_PE/100)
0.30
gnpuch
us_pe/100
0.25
0.20
0.15
0.10
0.05
0.00
-0.05
-0.10
-0.15
-0.20
1867
1877
1887
1897
1907
1917
1927
1937
1947
1957
1967
1977
1987
1997
41
ADVERTISEMENT
0 votes
Related Articles
Related forms


 - Twenty-first Century Scholars Program Credit - 2014")


 From The Department Of Veterans Affairs")


Related Categories
Parent category: Business