Ibps So Marketing Exam Template With Answers Page 38
ADVERTISEMENT
 1
1 2
2 3
3 4
4 5
5 6
6 7
7 8
8 9
9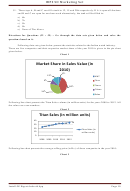 10
10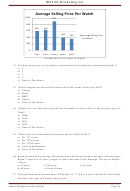 11
11 12
12 13
13 14
14 15
15 16
16 17
17 18
18 19
19 20
20 21
21 22
22 23
23 24
24 25
25 26
26 27
27 28
28 29
29 30
30 31
31 32
32 33
33 34
34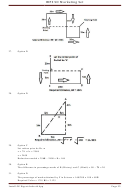 35
35 36
36 37
37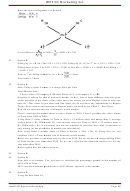 38
38 39
39 40
40 41
41 42
42 43
43 44
44 45
45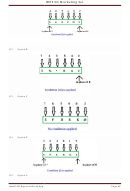 46
46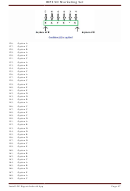 47
47 48
48IBPS SO Marketing Set
IBPS SO Marketing Set
IBPS SO Marketing Set
/
/
/
Here, the rule of allegation is to be used
Here, the rule of allegation is to be used
Here, the rule of allegation is to be used
/
/
/
=
=
=
=
=
=
Cost of Horse =
Cost of Horse =
Cost of Horse =
× 1800 =
× 1800 =
× 1800 =
× 1800 = Rs. 750
× 1800 = Rs. 750
× 1800 = Rs. 750
51.
51.
51.
Option B
Option B
Option B
st
st
st
nd
nd
nd
Filling by (A + B) in 1
Filling by (A + B) in 1
Filling by (A + B) in 1
hr 1/12 + 1/15 = 3/20, filling by (A +C) in 2
hr 1/12 + 1/15 = 3/20, filling by (A +C) in 2
hr 1/12 + 1/15 = 3/20, filling by (A +C) in 2
hr. = 1/12 + 1/20 = 2/15
hr. = 1/12 + 1/20 = 2/15
hr. = 1/12 + 1/20 = 2/15
Filling done in first 2 hr 3/20 + 2/15 = 17/60 in first 6hr = 17/60 × 3 = 15/60, Rest filling = 1
Filling done in first 2 hr 3/20 + 2/15 = 17/60 in first 6hr = 17/60 × 3 = 15/60, Rest filling = 1
Filling done in first 2 hr 3/20 + 2/15 = 17/60 in first 6hr = 17/60 × 3 = 15/60, Rest filling = 1
/
/
/
– 51/60 = 2/15
– 51/60 = 2/15
– 51/60 = 2/15
/
/
/
th
th
th
Now in 7
Now in 7
Now in 7
hr, filling is done by (A + B) in
hr, filling is done by (A + B) in
hr, filling is done by (A + B) in
= 1 hour
= 1 hour
= 1 hour
Total time = 7 hour
Total time = 7 hour
Total time = 7 hour
52.
52.
52.
Option B
Option B
Option B
Sales Value = Sales Volume × Average Price per Unit
Sales Value = Sales Volume × Average Price per Unit
Sales Value = Sales Volume × Average Price per Unit
Total Market Size :-
Total Market Size :-
Total Market Size :-
= Sales Value of Company X /Market Share (in %) of company X × 100
= Sales Value of Company X /Market Share (in %) of company X × 100
= Sales Value of Company X /Market Share (in %) of company X × 100
Question is asking for size of domestic market (in Rs.). Out of three different data sets given
Question is asking for size of domestic market (in Rs.). Out of three different data sets given
Question is asking for size of domestic market (in Rs.). Out of three different data sets given
in the question (a pie chart, a line chart and a bar chart), we have Rupees value in only one
in the question (a pie chart, a line chart and a bar chart), we have Rupees value in only one
in the question (a pie chart, a line chart and a bar chart), we have Rupees value in only one
data set – Bar chart. In pie chart and line chart, we do not have any information in Rupees
data set – Bar chart. In pie chart and line chart, we do not have any information in Rupees
data set – Bar chart. In pie chart and line chart, we do not have any information in Rupees
Terms. So to answer any question in Rupees terms, we need to use Chart 3 – Bar Chart.
Terms. So to answer any question in Rupees terms, we need to use Chart 3 – Bar Chart.
Terms. So to answer any question in Rupees terms, we need to use Chart 3 – Bar Chart.
How do we calculate the size of domestic watch market:
How do we calculate the size of domestic watch market:
How do we calculate the size of domestic watch market:
Chart 1 provides the market share in sales volume in 2010. Chart 2 provides the sales volume
Chart 1 provides the market share in sales volume in 2010. Chart 2 provides the sales volume
Chart 1 provides the market share in sales volume in 2010. Chart 2 provides the sales volume
of Titan from 2008 to 2012.
of Titan from 2008 to 2012.
of Titan from 2008 to 2012.
Using chart 2, Sales volume of Titan in 2010 = 32 million units and using chart 3, average
Using chart 2, Sales volume of Titan in 2010 = 32 million units and using chart 3, average
Using chart 2, Sales volume of Titan in 2010 = 32 million units and using chart 3, average
selling price = Rs. 900/watch. So, total market value for Titan in 2010 = 32 million units ×
selling price = Rs. 900/watch. So, total market value for Titan in 2010 = 32 million units ×
selling price = Rs. 900/watch. So, total market value for Titan in 2010 = 32 million units ×
Rs. 900/watch = Rs. X (Assume) [we are not required to calculate this value as question is
Rs. 900/watch = Rs. X (Assume) [we are not required to calculate this value as question is
Rs. 900/watch = Rs. X (Assume) [we are not required to calculate this value as question is
only asking for the possibility of market size calculation].
only asking for the possibility of market size calculation].
only asking for the possibility of market size calculation].
Now using chart I, market share of Titan is known = 38% = Rs. X. Using this, we can
Now using chart I, market share of Titan is known = 38% = Rs. X. Using this, we can
Now using chart I, market share of Titan is known = 38% = Rs. X. Using this, we can
calculate 100% = Total market size of domestic watch market.
calculate 100% = Total market size of domestic watch market.
calculate 100% = Total market size of domestic watch market.
Hence it is possible to calculate only for the year 2010. We do not have Average Selling Price
Hence it is possible to calculate only for the year 2010. We do not have Average Selling Price
Hence it is possible to calculate only for the year 2010. We do not have Average Selling Price
of Titan for the year other than 2010. So we can’t calculate the domestic market size for any
of Titan for the year other than 2010. So we can’t calculate the domestic market size for any
of Titan for the year other than 2010. So we can’t calculate the domestic market size for any
year other than 2010.
year other than 2010.
year other than 2010.
Hence option B is the correct answer.
Hence option B is the correct answer.
Hence option B is the correct answer.
53.
53.
53.
Option B
Option B
Option B
54.
54.
54.
Option D
Option D
Option D
Now this is no brainer. You just have to calculate the percentage growth in the number of
Now this is no brainer. You just have to calculate the percentage growth in the number of
Now this is no brainer. You just have to calculate the percentage growth in the number of
units sold of Titan.
units sold of Titan.
units sold of Titan.
2012 saw the minimum growth rate = 4.6%. Hence, option D is the answer.
2012 saw the minimum growth rate = 4.6%. Hence, option D is the answer.
2012 saw the minimum growth rate = 4.6%. Hence, option D is the answer.
55.
55.
55.
Option B
Option B
Option B
Using the data from A1,
Using the data from A1,
Using the data from A1,
Install GK Digest Android App
Install GK Digest Android App
Install GK Digest Android App
Page 38
Page 38
Page 38
ADVERTISEMENT
0 votes
Related Articles
Related forms


Related Categories
Parent category: Education