Statistics Worksheets With Answers - Newbattle High School Page 10
ADVERTISEMENT
 1
1 2
2 3
3 4
4 5
5 6
6 7
7 8
8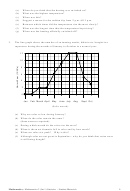 9
9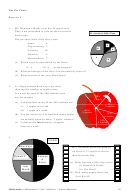 10
10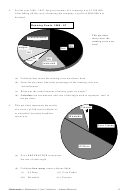 11
11 12
12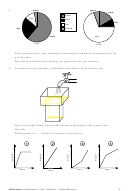 13
13 14
14 15
15 16
16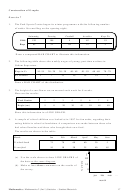 17
17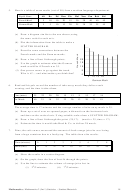 18
18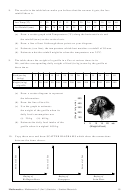 19
19 20
20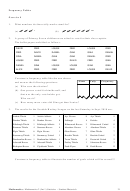 21
21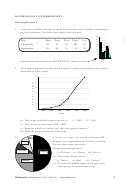 22
22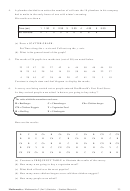 23
23 24
24 25
25 26
26 27
27 28
28 29
29 30
30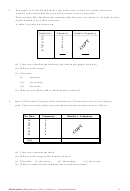 31
31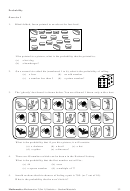 32
32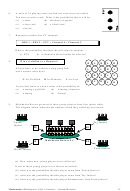 33
33 34
34 35
35 36
36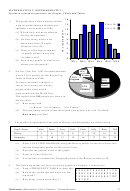 37
37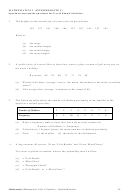 38
38 39
39 40
40 41
41 42
42 43
43 44
44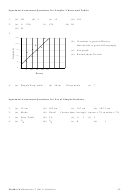 45
45The Pie Chart
Exercise 3
1.
Mr. Johnston’s Maths class has 28 pupils in it.
They were persuaded to vote for their favourite
Mr. Johnston's Maths Class
maths topic.
The pie chart shows how they voted
Sums
4
e
Trigonometry 2
d
a
Calculus
10
Statistics
5
c
Measurement 7.
b
(a) Which topic is represented by the letter:
(i) a
(ii) b
in the diagram?
(b) What percentage of the class is represented by letter d?
(c) What fraction of the class liked Sums?
2.
A college canteen draws up a pie chart
showing the number of apples eaten
in a week by each of the 200 students who
20%
use the canteen.
1 apple
(a) Calculate how many of the 200 students eat:
20%
(i)
3 apples in a week
0 apples
40%
(ii) 1 apple in a week.
2 apples
10%
(b) Use the answer to i) to find how many apples
4 apples
are actually eaten by these ‘3 apple’ students.
10%
(c) Calculate the total number of apples
3 apples
eaten in a week.
FILM
S
3.
FILMS
Die Hard
Mrs. Abraham asked her primary
six class of 32 pupils to choose
their favourite film.
Batman
Speed 2
&
(a) What fraction of the class chose
Robin
(i) Batman & Robin
Lost
(ii) Die Hard?
World
(b) How many pupils chose the
Lost World?
10
Mathematics: Mathematics 2 (Int 1) Statistics – Student Materials
ADVERTISEMENT
0 votes
Related Articles
Related forms


Related Categories
Parent category: Education