Statistics Worksheets With Answers - Newbattle High School Page 8
ADVERTISEMENT
 1
1 2
2 3
3 4
4 5
5 6
6 7
7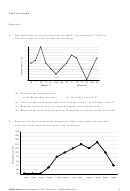 8
8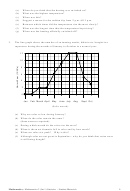 9
9 10
10 11
11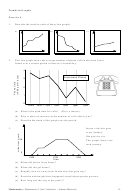 12
12 13
13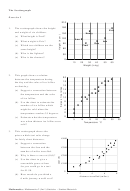 14
14 15
15 16
16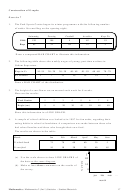 17
17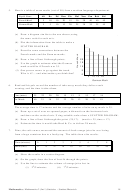 18
18 19
19 20
20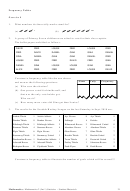 21
21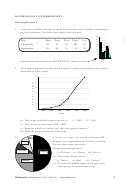 22
22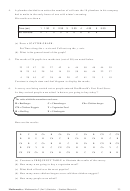 23
23 24
24 25
25 26
26 27
27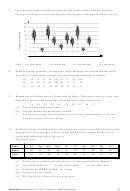 28
28 29
29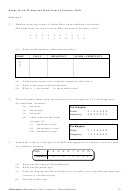 30
30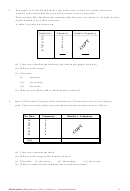 31
31 32
32 33
33 34
34 35
35 36
36 37
37 38
38 39
39 40
40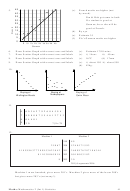 41
41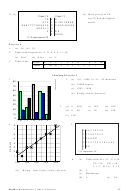 42
42 43
43 44
44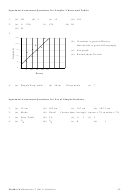 45
45The Line Graph
Exercise 2
1.
The temperature on top of a town hall was taken every morning at 11.00 a.m.
This line graph was made up from the recordings.
8
7
6
5
4
3
2
1
0
- 1
- 2
- 3
- 4
M
T
W Th Fr
Sat Su M
T
W Th Fr
Sat Su
(Week 1)
(Week 2)
(a) What was the temperature on:
(i) the Wednesday of week 1
(ii) the Friday of week 2?
(b) What was the fall in temperature from Tuesday, week 2 - until Friday, week 2?
(c) Between which two days was there the biggest rise in temperature?
(d) What was the trend of the graph from Wednesday to Saturday of the first week?
2.
Someone was also recording the temperature of the rooms inside the town hall
every hour from when she arrived at 7 a.m. until 6 p.m.
3 0
2 8
2 6
2 4
2 2
2 0
1 8
1 6
1 4
1 2
1 0
7am
8am
9am 10am
11am noon
1pm 2pm
3pm
4pm
5pm
6pm
8
Mathematics: Mathematics 2 (Int 1) Statistics – Student Materials
ADVERTISEMENT
0 votes
Related Articles
Related forms


Related Categories
Parent category: Education