Statistics Worksheets With Answers - Newbattle High School Page 12
ADVERTISEMENT
 1
1 2
2 3
3 4
4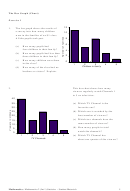 5
5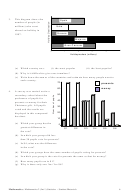 6
6 7
7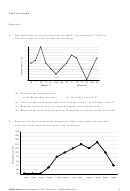 8
8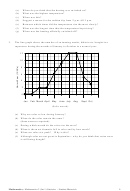 9
9 10
10 11
11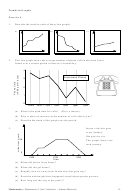 12
12 13
13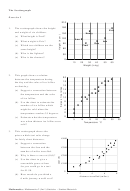 14
14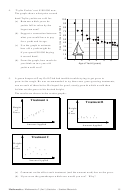 15
15 16
16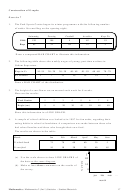 17
17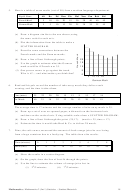 18
18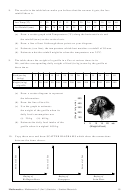 19
19 20
20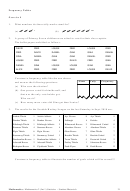 21
21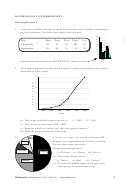 22
22 23
23 24
24 25
25 26
26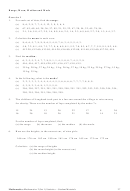 27
27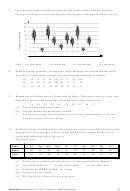 28
28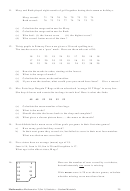 29
29 30
30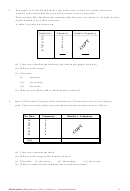 31
31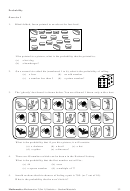 32
32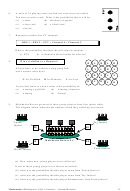 33
33 34
34 35
35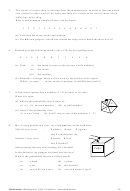 36
36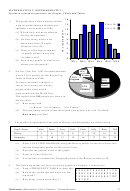 37
37 38
38 39
39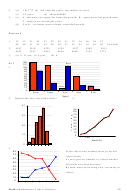 40
40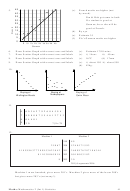 41
41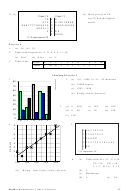 42
42 43
43 44
44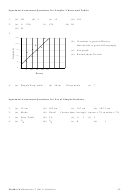 45
45Trends in Graphs
Exercise 4
1.
Describe the trend in each of these line graphs:
a)
b)
c)
2.
This line graph shows the average number of phone calls made from Scara
Island over a certain period of time in a normal day.
Scara Island Phones
4
Scara Island Phones
3
2
1
0
10am noon
2pm
4pm
6pm
8pm
10pm
10
2
4
6
8
10
(a) What is the peak time for calls? (Give a reason.)
(b) Why is there an increase in the number of calls after 6 p.m.?
(c) Describe the trend of the graph over the period.
3.
Janice visits her gran
every Sunday.
She goes by car.
30
This graph, shows one
such journey.
0
1000
1100
1200
Time
(a) When did Janice leave home?
(b) When did she get home?
(c) Roughly how far away from Janice does her gran stay?
(d) Describe what might have happened round about quarter past ten.
(e) How long did she stay at her gran’s?
12
Mathematics: Mathematics 2 (Int 1) Statistics – Student Materials
ADVERTISEMENT
0 votes
Related Articles
Related forms


Related Categories
Parent category: Education