Statistics Worksheets With Answers - Newbattle High School Page 6
ADVERTISEMENT
 1
1 2
2 3
3 4
4 5
5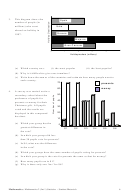 6
6 7
7 8
8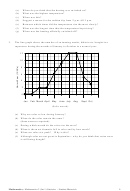 9
9 10
10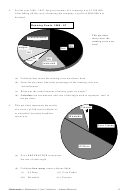 11
11 12
12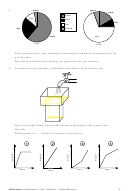 13
13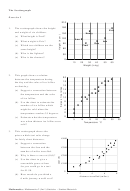 14
14 15
15 16
16 17
17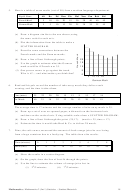 18
18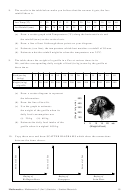 19
19 20
20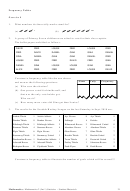 21
21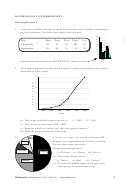 22
22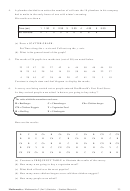 23
23 24
24 25
25 26
26 27
27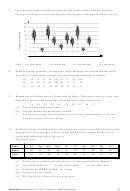 28
28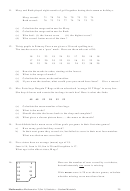 29
29 30
30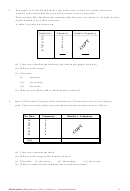 31
31 32
32 33
33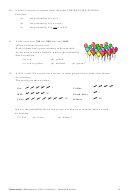 34
34 35
35 36
36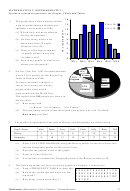 37
37 38
38 39
39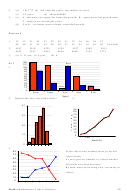 40
40 41
41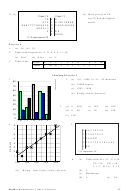 42
42 43
43 44
44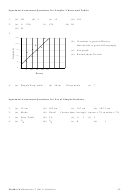 45
453.
This diagram shows the
Spain
number of people (in
millions) who went
Ibiza
abroad on holiday in
Greece
1997.
Majorca
Gran Canaria
0
1
2
3
4
Holidaymakers (millions)
(a) Which country was:
(i) the most popular
(ii) the least popular?
(b) Why is it difficult to give exact numbers?
(c) Write down the names of the countries and estimate how many people went to
each country.
70
presents
60
money
4.
A survey was carried out in a
50
secondary school about the
preference of pupils for
40
presents or money for their
Christmas gift. All pupils
30
voted and the results are
displayed in this compound
20
bar chart.
10
(a) Which year group has the
0
greatest difference in
S1
S2
S3
S4
S5
S6
the vote?
(b) In which year groups did less
than 30 pupils vote for presents?
(c) In S4, what was the difference
in the vote?
(d) Which year groups have the same number of pupils voting for presents?
(e) In which year group is the vote for presents the same as that for money?
(f) How many pupils are in S1?
(g) Why is there only one ‘bar’ for S6?
6
Mathematics: Mathematics 2 (Int 1) Statistics – Student Materials
ADVERTISEMENT
0 votes
Related Articles
Related forms


Related Categories
Parent category: Education