Statistics Worksheets With Answers - Newbattle High School Page 28
ADVERTISEMENT
 1
1 2
2 3
3 4
4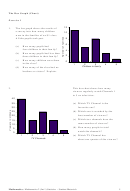 5
5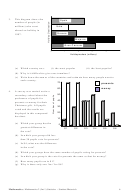 6
6 7
7 8
8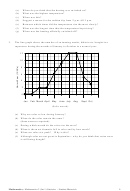 9
9 10
10 11
11 12
12 13
13 14
14 15
15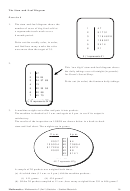 16
16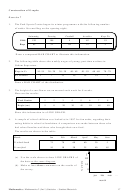 17
17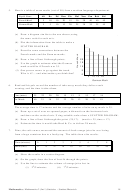 18
18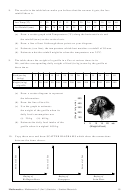 19
19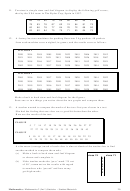 20
20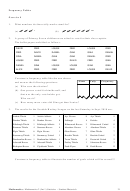 21
21 22
22 23
23 24
24 25
25 26
26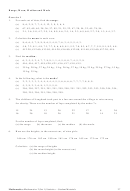 27
27 28
28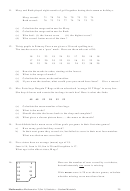 29
29 30
30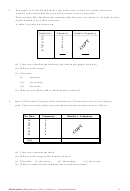 31
31 32
32 33
33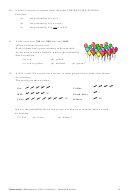 34
34 35
35 36
36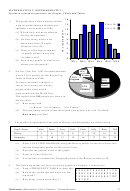 37
37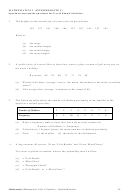 38
38 39
39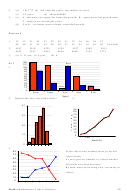 40
40 41
41 42
42 43
43 44
44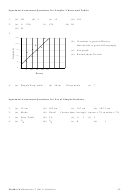 45
457.
Every morning of his Caribbean holiday, Gerald would climb a different palm tree.
The top of each figure in the diagram shows the heights of the trees which he climbed.
16
14
12
10
8
6
4
2
0
Find:
(a) the range
(b) the mean
(c) the median
(d) the mode.
8.
In the following examples, calculate the range, the mean, the median and the mode.
In each case, state which ‘average’ best illustrates the catalogue of numbers.
(a)
18 18 19 20 20 20 21 25 163.
(b)
34 34 34 34 36 36 37 57
85.
(c)
56 56 57 58 59 60 62 65
67.
9.
Brenda and her brother went to Disneyland for Easter. They kept a note as to how long
they had to queue to get on the rides. Here are their results (in minutes):
16
30
25
20
10
110
10
22
40
17
(a)
Calculate the mean time waited.
(b)
Find the median and modal times waited.
(c)
Say which ‘average’ should be chosen to give a fair representation of the data.
Give two reasons for your choice.
10.
Frank and his pals decided to have a day at an army assault course. They each recorded
the number of press-ups they could do in one minute before attempting the assault
course and again at the end of the course.
The results were:
Name
Alf
Bert
Karl
Dino
Ed
Flo
Jim
Ned
Ian
Jan
Before
48
46
48
40
45
51
47
40
50
46
After
36
38
42
35
36
46
32
28
41
38
(a)
Which person seemed to be affected most by the assault course? Reason??
(b)
Find the RANGE for
(i) the ‘before’ data
(ii) the ‘after’ data.
(c)
Calculate the MEAN for both sets of data.
(d)
Comment on the results.
(e)
Was Ian above or below average both times?
28
Mathematics: Mathematics 2 (Int 1) Statistics – Student Materials
ADVERTISEMENT
0 votes
Related Articles
Related forms


Related Categories
Parent category: Education