Statistics Worksheets With Answers - Newbattle High School Page 3
ADVERTISEMENT
 1
1 2
2 3
3 4
4 5
5 6
6 7
7 8
8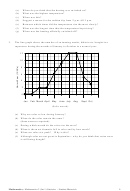 9
9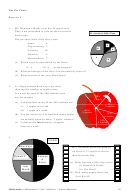 10
10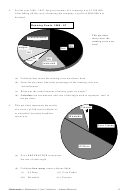 11
11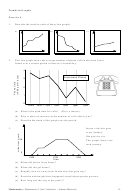 12
12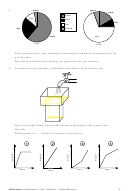 13
13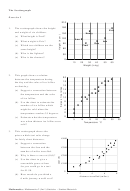 14
14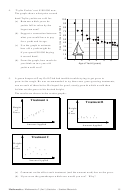 15
15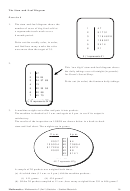 16
16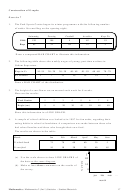 17
17 18
18 19
19 20
20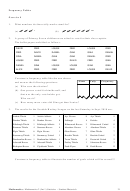 21
21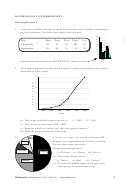 22
22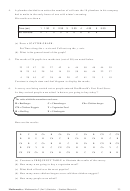 23
23 24
24 25
25 26
26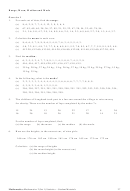 27
27 28
28 29
29 30
30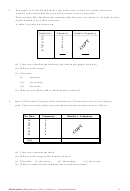 31
31 32
32 33
33 34
34 35
35 36
36 37
37 38
38 39
39 40
40 41
41 42
42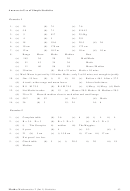 43
43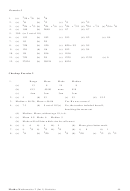 44
44 45
45GRAPHS, CHARTS AND TABLES
By the end of this set of exercises, you should be able to
(a)
extract and interpret data from bar charts, line graphs, pie charts
and stem-and-leaf diagrams, and interpret trends in graphs.
(b)
construct bar charts, line graphs, stem-and-leaf diagrams,
and scattergraphs (scatter diagrams) from given data.
Also, draw a best-fitting line by eye on a scattergraph and use
it to estimate the value of one variable given the other.
(c)
construct frequency tables from data without class intervals.
3
Mathematics: Mathematics 2 (Int 1) Statistics – Student Materials
ADVERTISEMENT
0 votes
Related Articles
Related forms


Related Categories
Parent category: Education