Statistics Worksheets With Answers - Newbattle High School Page 11
ADVERTISEMENT
 1
1 2
2 3
3 4
4 5
5 6
6 7
7 8
8 9
9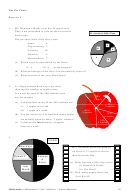 10
10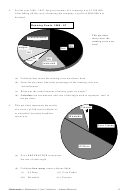 11
11 12
12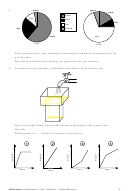 13
13 14
14 15
15 16
16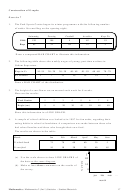 17
17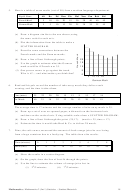 18
18 19
19 20
20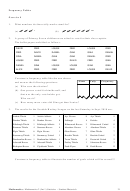 21
21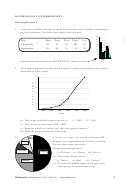 22
22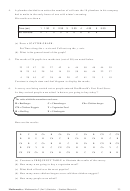 23
23 24
24 25
25 26
26 27
27 28
28 29
29 30
30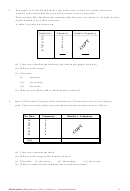 31
31 32
32 33
33 34
34 35
35 36
36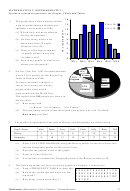 37
37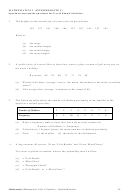 38
38 39
39 40
40 41
41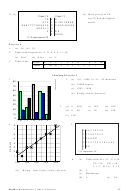 42
42 43
43 44
44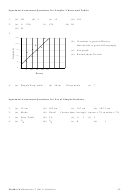 45
454.
For the year 1996 - 1997, the gross income of a company was £3 700 000.
After taking off the costs of running the company, a profit of £500 000 was
declared.
Running Costs 1996 - 97
This pie-chart
miscellaneous
shows how the
21.0%
running costs were
used.
42%
wages
fuel
14%
5%
18%
rent
materials
(a) Calculate how much the running costs must have been.
(b) From the pie chart, find what percentage of the running costs was
‘miscellaneous’.
(c) What was the actual amount of money spent on wages?
(d) Calculate (do not measure) the size of the angle used to represent ‘rent’ in
the pie chart.
5.
This pie chart represents the results
Frosties
of a survey of 240 senior citizens as
to what their favourite breakfast
Weetabix
cereal was.
Corn Flakes
All Bran
(a) Use a PROTRACTOR to measure
the size of each angle.
(b) Calculate how many senior citizens liked:
(i)
All Bran
(ii) Corn Flakes
(iii) Weetabix
(iv) Frosties.
11
Mathematics: Mathematics 2 (Int 1) Statistics – Student Materials
ADVERTISEMENT
0 votes
Related Articles
Related forms


Related Categories
Parent category: Education