Statistics Worksheets With Answers - Newbattle High School Page 19
ADVERTISEMENT
 1
1 2
2 3
3 4
4 5
5 6
6 7
7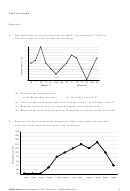 8
8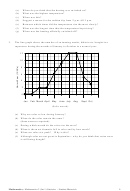 9
9 10
10 11
11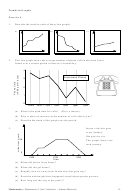 12
12 13
13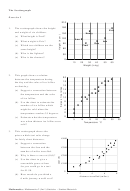 14
14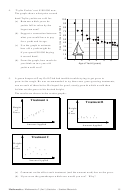 15
15 16
16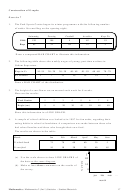 17
17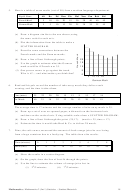 18
18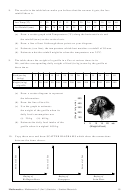 19
19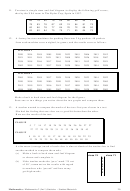 20
20 21
21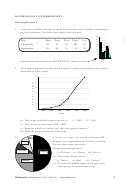 22
22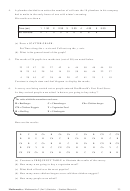 23
23 24
24 25
25 26
26 27
27 28
28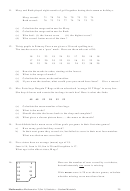 29
29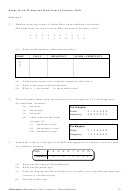 30
30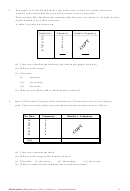 31
31 32
32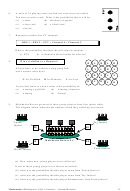 33
33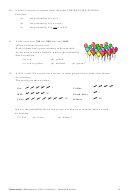 34
34 35
35 36
36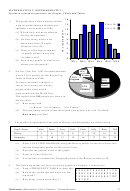 37
37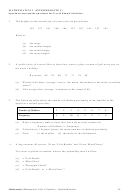 38
38 39
39 40
40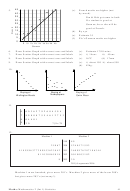 41
41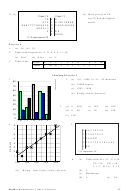 42
42 43
43 44
44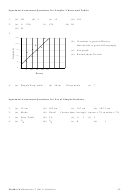 45
458.
The results in the table below make you believe that the warmer it gets, the less
rainfall there is.
Ave Temp (°C)
5
10
10
12
15
18
20
24
28
30
35
40
Ave Rainfall (mm)
90
80
70
68
58
35
15
17
17
15
12
8
(a) Draw a scatter graph with Temperature (°C) along the horizontal axis and
the rainfall (mm) on the vertical axis.
(b) Draw a line of best fit through these points on your diagram.
(c) Estimate, (see line), the temperature which best matches a rainfall of 50 mm.
(d) Estimate what the rainfall might be when the temperature was 25°C.
9.
The table shows the weight of a gorilla in a Zoo at various times in its
life, and the corresponding daily weight of food (in kg) eaten by the gorilla at
those times.
Food per day
3
9
10
15
15
18
25
26
30
35
40
45
50
(in kg)
Weight (in kg)
5
50 100
90 100
100
200
180
200
350
350
450
500
of gorilla
(a) Draw a scatter diagram to represent
the information.
500
(b) Draw the line of best fit.
400
(c) Use the graph to estimate:
300
the weight of the gorilla when its
200
daily food consumption was
100
(i) 20 kg
(ii) 60 kg.
(d) Estimate the daily food intake of the
0
5
10
15
20
etc
gorilla when it weighed 400 kg.
(Weight of food)
10. Copy these axes and draw SCATTER DIAGRAMS which show the connections
between the items shown.
Buying of
Buying of
Buying of
Wellington Boots
Newspapers
Swim Wear
19
Mathematics: Mathematics 2 (Int 1) Statistics – Student Materials
ADVERTISEMENT
0 votes
Related Articles
Related forms


Related Categories
Parent category: Education