Statistics Worksheets With Answers - Newbattle High School Page 17
ADVERTISEMENT
 1
1 2
2 3
3 4
4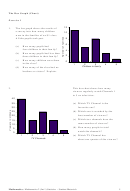 5
5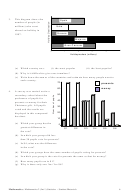 6
6 7
7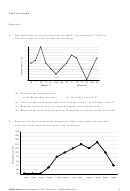 8
8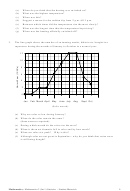 9
9 10
10 11
11 12
12 13
13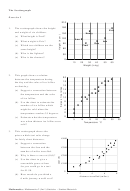 14
14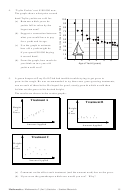 15
15 16
16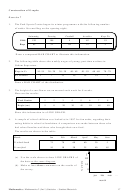 17
17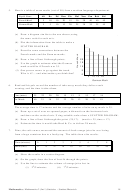 18
18 19
19 20
20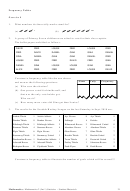 21
21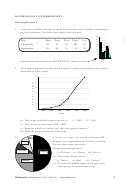 22
22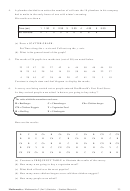 23
23 24
24 25
25 26
26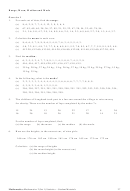 27
27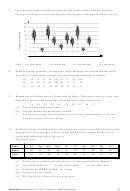 28
28 29
29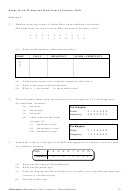 30
30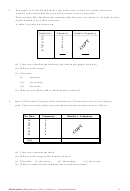 31
31 32
32 33
33 34
34 35
35 36
36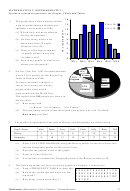 37
37 38
38 39
39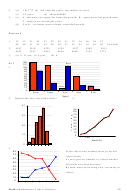 40
40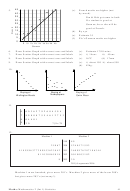 41
41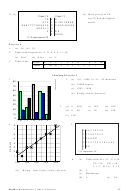 42
42 43
43 44
44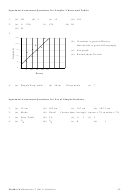 45
45Construction of Graphs
Exercise 7
1.
The Park Sports Centre began its winter programme with the following number
of under 16s enrolling on the opening night.
Swimming
Fencing
Football
Aerobics
Keep Fit
Girls
120
108
9
62
19
Boys
85
32
05
22
5
Draw a compound BAR CHART to illustrate this information.
2.
The following table shows the weekly wages of young, part-time workers in
Orkam Superstore.
Wage in £’s
10 -19
20 - 29
30 - 39
40 - 49
50 - 59
60 - 69
70 - 79
No. Workers
3
7
23
29
38
14
1
Draw a BAR CHART of the distribution.
3.
The height of a sun flower was measured each week for 8 weeks.
Here are the results:
Week Number
1
2
3
4
5
6
7
8
Wage in £’s
10 -19
20 - 29 30 - 39 40 - 49
50 - 59
60 - 69
70 -
79 No. Workers
3
7
23
29
38
Height (cm)
5
8
20
30
45
59
65
89
Show this information in a LINE GRAPH.
4.
A sample of school children was looked at in 1997 for 6 months, regarding their
eating habits in school at lunchtime. A comparison was made between those who
had school lunches and those who brought their own food.
The results are shown in the table:
Month
Jan
Feb
March
April
May
June
% school lunch
75
70
60
60
30
5
% own food
10
10
30
35
40
65
(a) Use the scale shown to draw LINE GRAPHS of
20
the data on the same diagram.
10
(b) Make at least three comments on the results of
the survey.
0
jan
feb
mar
...
month
17
Mathematics: Mathematics 2 (Int 1) Statistics – Student Materials
ADVERTISEMENT
0 votes
Related Articles
Related forms


Related Categories
Parent category: Education