Statistics Worksheets With Answers - Newbattle High School Page 23
ADVERTISEMENT
 1
1 2
2 3
3 4
4 5
5 6
6 7
7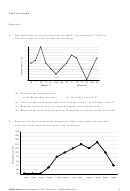 8
8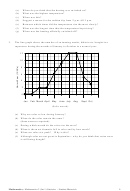 9
9 10
10 11
11 12
12 13
13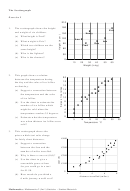 14
14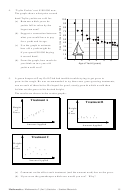 15
15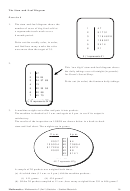 16
16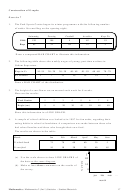 17
17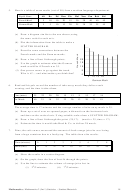 18
18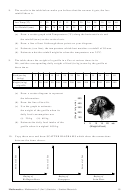 19
19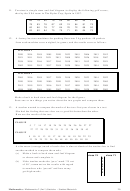 20
20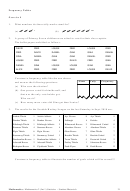 21
21 22
22 23
23 24
24 25
25 26
26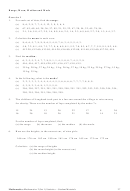 27
27 28
28 29
29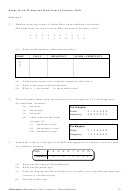 30
30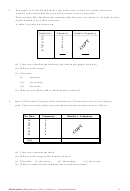 31
31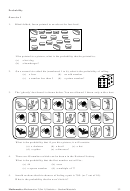 32
32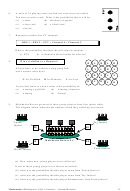 33
33 34
34 35
35 36
36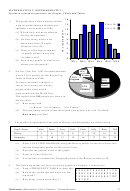 37
37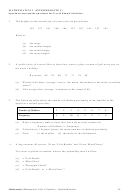 38
38 39
39 40
40 41
41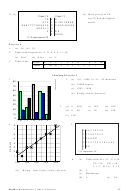 42
42 43
43 44
44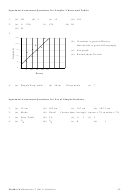 45
454.
A plumber decided to monitor the number of call-outs the 10 plumbers in his company
had to make in the early hours of one cold winter’s morning.
His results are shown.
Time (am)
1 1.30
2
2.30
3
3.30
4
4.30
5
5.30
No. call-outs
2
1
3
3
4
5
6
6
8
(a) Draw a SCATTER GRAPH.
Put Time along the x -axis and Call-outs up the y -axis.
(b) What is the general trend of the graph?
5.
The marks of 36 pupils in a maths test (out of 50) are noted below.
23
12
47
35
27
42
6
44
50
48
44
39
18
25
45
28
36
14
39
50
46
44
22
37
4
29
45
47
38
44
28
47
41
25
3
19
Construct a simple stem-and-leaf diagram to display the marks.
6.
A survey was being carried out as people entered DucMonald’s Fast Food Store.
As they arrived people were asked ‘what are you going to buy today’?
The codes which the researchers used were:
B = Beefburger
C = Cheeseburger
Ch = Chicken burger
CN = Chicken Nuggets
V = Vegetarian Food
H = Hot Dog
U = Ultrabargain
Here are the results:
B
C
B
Ch
B
Ch
Ch
U
Ch
B
CN
C
CN
B
H
U
H
Ch
C
B
Ch
B
Ch
B
C
B
Ch
B
C
Ch
B
H
C
B
Ch
B
CN
B
CN
B
CN
V
B
C
CN
CN
H
B
H
Ch
V
C
CN
CN
Ch
B
Ch
B
CN
B
C
Ch
C
B
H
(a) Construct a FREQUENCY TABLE to illustrate the results of the survey.
(b) How many were going to buy a vegetarian meal?
(c) What kind of food was the most popular?
(d) How many more chicken burgers were sold than chicken nuggets?
(e) How many people were asked?
23
Mathematics: Mathematics 2 (Int 1) Statistics – Student Materials
ADVERTISEMENT
0 votes
Related Articles
Related forms


Related Categories
Parent category: Education