Statistics Worksheets With Answers - Newbattle High School Page 45
ADVERTISEMENT
 1
1 2
2 3
3 4
4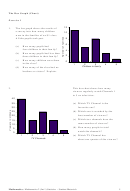 5
5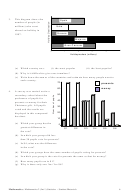 6
6 7
7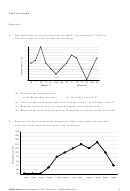 8
8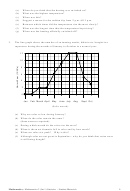 9
9 10
10 11
11 12
12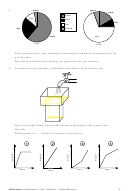 13
13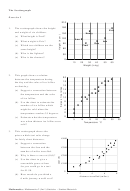 14
14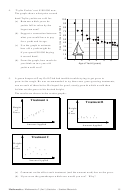 15
15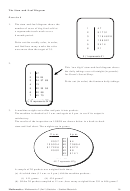 16
16 17
17 18
18 19
19 20
20 21
21 22
22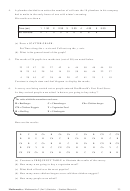 23
23 24
24 25
25 26
26 27
27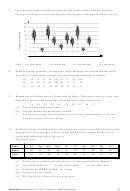 28
28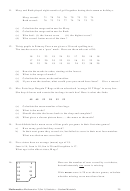 29
29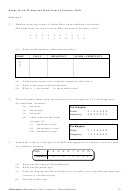 30
30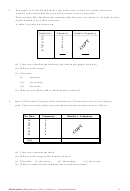 31
31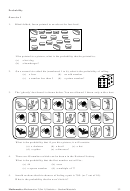 32
32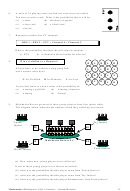 33
33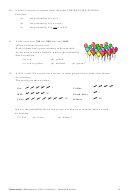 34
34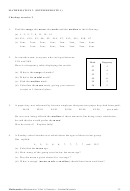 35
35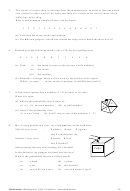 36
36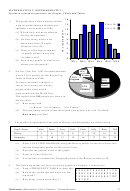 37
37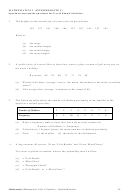 38
38 39
39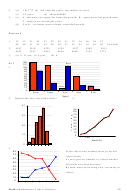 40
40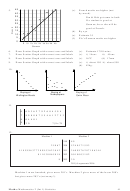 41
41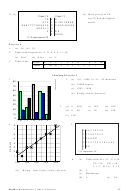 42
42 43
43 44
44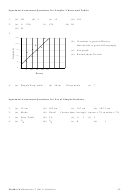 45
45Specimen Assessment Questions for Graphs, Charts and Tables
1.
(a) 1K
(b) 3
(c) 15
(d) 110
2.
(a) i)
250
ii) 125
iii) 50
(b) 25
3.
2 5
x
(b) If student is good at History
2 0
x
then he/she is good at Geography
x
x
1 5
(c) See graph
x
x
(d) Round about 20 also!
1 0
x
x
5
0
5
10
15
20 25
History
4.
(a) Simple Freq. table
(b) 50 sat
10 top mark
(c) 7
Specimen Assessment Questions for Use of Simple Statistics
1.
(a) 12 cm
(b) 162 cm
(c) 157 cm
(d) 162·1 cm
2.
(a) Mode
(b) Good!
1 better than ‘average’. (mean = 75, median = 71)
3.
(a) Freq. Table
(b) 3·4
(c) i)
3
ii) 3
3
1
4.
(a)
/
(b)
/
(c) 0
(d)
1
4
4
Maths: Mathematics 2 (Int 1) Statistics
45
ADVERTISEMENT
0 votes
Related Articles
Related forms


Related Categories
Parent category: Education