Organize, Display, And Interpret Data Worksheet - Chapter 3 Page 16
ADVERTISEMENT
 1
1 2
2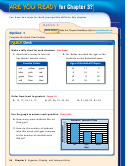 3
3 4
4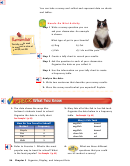 5
5 6
6 7
7 8
8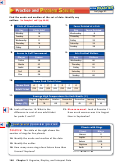 9
9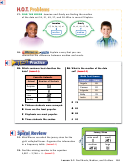 10
10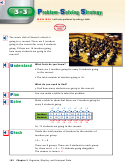 11
11 12
12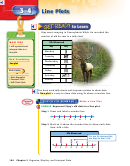 13
13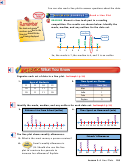 14
14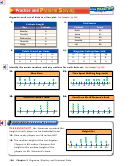 15
15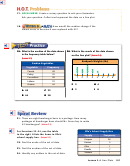 16
16 17
17 18
18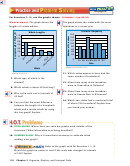 19
19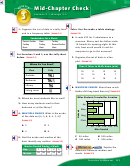 20
20 21
21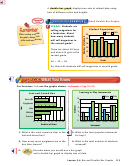 22
22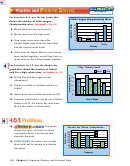 23
23 24
24 25
25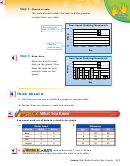 26
26 27
27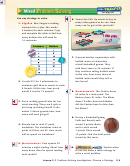 28
28 29
29 30
30 31
31 32
32 33
33 34
34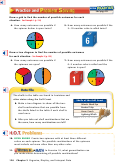 35
35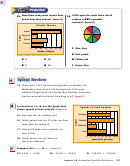 36
36 37
37 38
38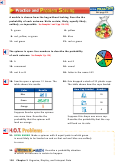 39
39 40
40 41
41 42
42 43
43 44
44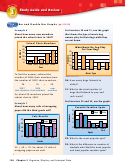 45
45 46
46 47
47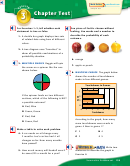 48
48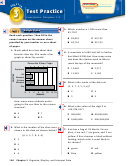 49
49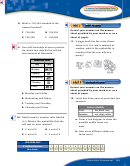 50
5017.
OPEN ENDED
Create a survey question to ask your classmates.
Ask your question. Collect and represent the data on a line plot.
18.
How would the median change if the
lowest score in Exercise 8 was replaced with 93?
19. What is the median of the data shown
19. What is the median of the data shown
19. What is the median of the data shown
19. What is the median of the data shown
20. What is the mode of the data shown
20. What is the mode of the data shown
20. What is the mode of the data shown
20. What is the mode of the data shown
in the frequency table below?
in the frequency table below?
in the frequency table below?
in the frequency table below?
on the line plot?
on the line plot?
on the line plot?
on the line plot?
(Lesson 3-4)
(Lesson 3-4)
(Lesson 3-4)
(Lesson 3-4)
(Lesson 3-2)
(Lesson 3-2)
(Lesson 3-2)
(Lesson 3-2)
Backpack Weights (lbs)
Backpack Weights (lbs)
Backpack Weights (lbs)
Backpack Weights (lbs)
Backpack Weights (lbs)
Garden Vegetables
Garden Vegetables
Garden Vegetables
Garden Vegetables
Garden Vegetables
Vegetable
Vegetable
Vegetable
Vegetable
Vegetable
Frequency
Frequency
Frequency
Frequency
Frequency
Carrots
Carrots
Carrots
Carrots
Carrots
49
49
49
49
49
Celery
Celery
Celery
Celery
Celery
25
25
25
25
25
1
1
1
1
1
2
2
2
2
2
3
3
3
3
3
4
4
4
4
4
5
5
5
5
5
6
6
6
6
6
7
7
7
7
7
8
8
8
8
8
Cucumbers
Cucumbers
Cucumbers
Cucumbers
Cucumbers
28
28
28
28
28
Lettuce
Lettuce
Lettuce
Lettuce
Lettuce
32
32
32
32
32
F 2
F 2
F 2
F 2
H 4
H 4
H 4
H 4
Onions
Onions
Onions
Onions
Onions
44
44
44
44
44
G 3
G 3
G 3
G 3
J 8
J 8
J 8
J 8
A 49
A 49
A 49
A 49
C 32
C 32
C 32
C 32
B 44
B 44
B 44
B 44
D 28
D 28
D 28
D 28
21. There are eight hamburger buns in a package. How many
packages of hamburger buns should Mr. Green buy to make
43 hamburgers?
(Lesson 3-3)
For Exercises 22–24, use the table
Ella’s School Supply Box
Ella’s School Supply Box
Ella’s School Supply Box
to the right. It lists the items in Ella’s
Supply
Supply
Supply
Frequency
Frequency
Frequency
school supply box.
(Lesson 3-2)
Crayons
Crayons
Crayons
36
36
36
22. Find the mode of the set of data.
Erasers
Erasers
Erasers
5
5
5
Glue
Glue
Glue
1
1
1
23. Find the median of the set of data.
Pencils
Pencils
Pencils
7
7
7
Scissors
Scissors
Scissors
1
1
1
24. Identify any outliers in the set of data.
Lesson 3-4 Line Plots 107
ADVERTISEMENT
0 votes
Related Articles
Related forms


 Worksheet - Chapter 3")


Related Categories
Parent category: Education