Organize, Display, And Interpret Data Worksheet - Chapter 3 Page 17
ADVERTISEMENT
 1
1 2
2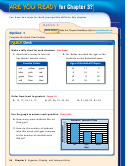 3
3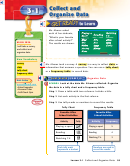 4
4 5
5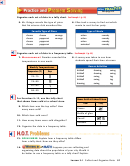 6
6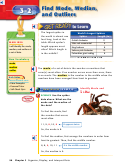 7
7 8
8 9
9 10
10 11
11 12
12 13
13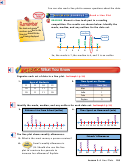 14
14 15
15 16
16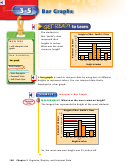 17
17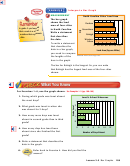 18
18 19
19 20
20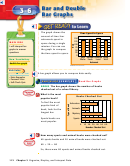 21
21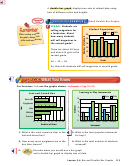 22
22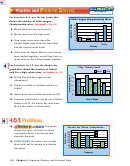 23
23 24
24 25
25 26
26 27
27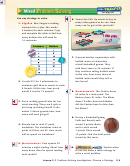 28
28 29
29 30
30 31
31 32
32 33
33 34
34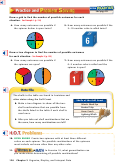 35
35 36
36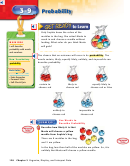 37
37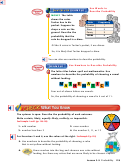 38
38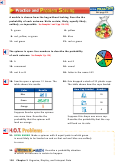 39
39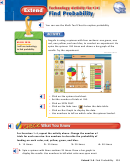 40
40 41
41 42
42 43
43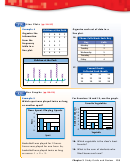 44
44 45
45 46
46 47
47 48
48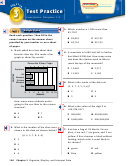 49
49 50
503-5
Bar Graphs
The students in
Height of Mrs. Smith’s Class
Height of Mrs. Smith’s Class
Height of Mrs. Smith’s Class
Mrs. Smith’s class
10
10
10
9
9
9
measured their
MAIN IDEA
8
8
8
heights in inches.
7
7
7
6
6
6
I will interpret a bar
What was the most
5
5
5
graph.
common height?
4
4
4
3
3
3
2
2
2
New Vocabulary
1
1
1
bar graph
0
0
0
52
52
52
53
53
53
54
54
54
55
55
55
56
56
56
57
57
57
58
58
58
Height in Inches
Height in Inches
Height in Inches
Math Online
Math Online
Math Online
• Extra Examples
• Personal Tutor
A bar graph is used to compare data by using bars of different
C03-01A-105711-B
C03-01A-105711-B
• Self-Check Quiz
heights to represent values. You can interpret data that is
displayed in a bar graph.
EXAMPLE
Interpret a Bar Graph
1
MEASUREMENT
What was the most common height?
The longest bar represents the height of the most students.
Height of Mrs. Smith’s Class
10
9
8
7
6
5
4
3
2
1
0
52
53
54
55
56
57
58
Height in Inches
So, the most common height was 55 inches tall.
C03-02A-105711-B
108 Chapter 3 Organize, Display, and Interpret Data
ADVERTISEMENT
0 votes
Related Articles
Related forms


 Worksheet - Chapter 3")


Related Categories
Parent category: Education