Organize, Display, And Interpret Data Worksheet - Chapter 3 Page 26
ADVERTISEMENT
 1
1 2
2 3
3 4
4 5
5 6
6 7
7 8
8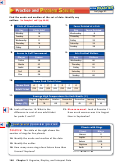 9
9 10
10 11
11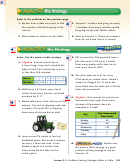 12
12 13
13 14
14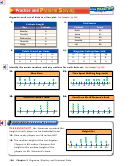 15
15 16
16 17
17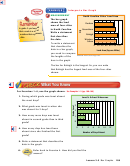 18
18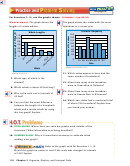 19
19 20
20 21
21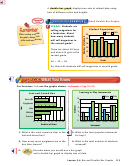 22
22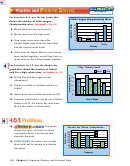 23
23 24
24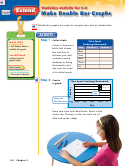 25
25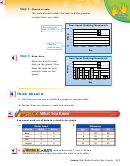 26
26 27
27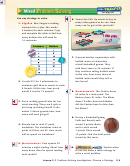 28
28 29
29 30
30 31
31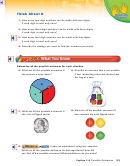 32
32 33
33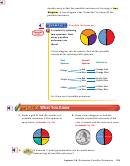 34
34 35
35 36
36 37
37 38
38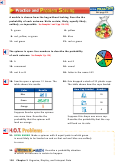 39
39 40
40 41
41 42
42 43
43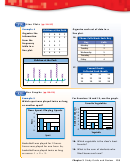 44
44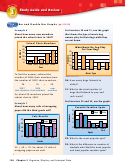 45
45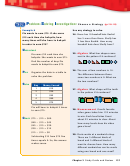 46
46 47
47 48
48 49
49 50
50Step 3
Choose a scale.
The scale should include the least and the greatest
number from your data.
Time Spent Studying/Homework
This scale goes
90
from 0–90 by 15s.
Student 1
75
Student 2
60
45
30
15
Start the
0
Mon.
Tues.
Wed.
Thurs.
Fri.
scale at zero.
Day
Step 4
Draw bars.
Time Spent Studying/Homework
Draw the bars for your
90
Student 1
75
data on the graph. Then
Student 2
60
draw the bars for your
45
partner’s data on the
30
graph.
15
0
Mon. Tues.
Wed. Thurs.
Fri.
Day
Think About It
1. Tell how you can use a double bar graph to compare data.
2. Explain how you choose a scale and intervals.
Represent each set of data in a double bar graph.
3.
4.
Books Read
Allowance
Month
Miki
Alicia
Age
Morgan
Eli
May
3
2
7
$2
$0
June
5
6
8
$3
$1
July
4
5
9
$4
$3
August
6
4
10
$5
$5
5.
Look at Exercises 3 and 4. Write a
comparison sentence that describes the data in each table.
Extend 3-6 Make Double Bar Graphs 117
ADVERTISEMENT
0 votes
Related Articles
Related forms


 Worksheet - Chapter 3")


Related Categories
Parent category: Education