Organize, Display, And Interpret Data Worksheet - Chapter 3 Page 6
ADVERTISEMENT
 1
1 2
2 3
3 4
4 5
5 6
6 7
7 8
8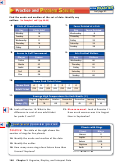 9
9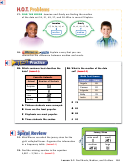 10
10 11
11 12
12 13
13 14
14 15
15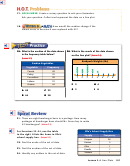 16
16 17
17 18
18 19
19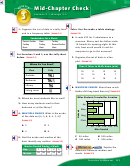 20
20 21
21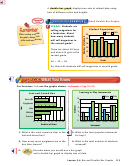 22
22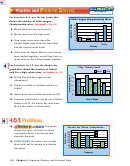 23
23 24
24 25
25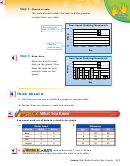 26
26 27
27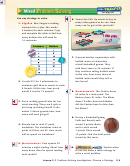 28
28 29
29 30
30 31
31 32
32 33
33 34
34 35
35 36
36 37
37 38
38 39
39 40
40 41
41 42
42 43
43 44
44 45
45 46
46 47
47 48
48 49
49 50
50EXTRA
See page R6.
Organize each set of data in a tally chart.
See Example 1 (p. 95)
5. Mr. Ortega records the type of pizza
6. Elisa took a survey to find out which
that his science club members like.
movie to rent for her party.
Favorite Type of Pizza
Type of Movie
sausage
comedy
cheese
cheese
action
cheese
pepperoni
sausage
action
comedy
cheese
pepperoni
action
comedy
animated
comedy
cheese
pepperoni
Organize each set of data in a frequency table.
See Example 1 (p. 95)
Measurement
8. A survey was taken to see how
7.
Damián recorded the
students spend their time at recess.
temperatures in one week.
Recess Activities
Weekly Temperatures
swing
kickball
drawing
Temperature (°F)
Days
kickball
drawing
swing
70–75
kickball
swing
tag
kickball
swing
tag
76–80
drawing
swing
tag
81–85
86–90
For Exercises 9–12, use the tally chart
Items Sold at School Store
that shows items sold at a school store.
Item
Tally
9. Which item was the top seller? How
Eraser
many were sold?
Bottle of glue
10. Which item sold once?
Pencil
11. How many items were sold altogether?
Scissors
12. Organize the data in a frequency table.
13.
OPEN ENDED
Explain how a frequency table differs
from a tally chart. How are they alike?
14.
Suppose you are collecting and
organizing data about the population of your city. Would it
be better to use a frequency table or a tally chart? Explain.
Lesson 3-1 Collect and Organize Data 97
ADVERTISEMENT
0 votes
Related Articles
Related forms


 Worksheet - Chapter 3")


Related Categories
Parent category: Education