Organize, Display, And Interpret Data Worksheet - Chapter 3 Page 40
ADVERTISEMENT
 1
1 2
2 3
3 4
4 5
5 6
6 7
7 8
8 9
9 10
10 11
11 12
12 13
13 14
14 15
15 16
16 17
17 18
18 19
19 20
20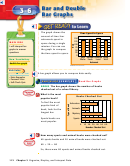 21
21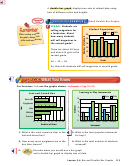 22
22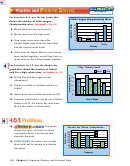 23
23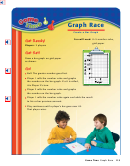 24
24 25
25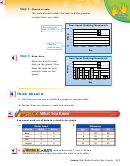 26
26 27
27 28
28 29
29 30
30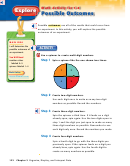 31
31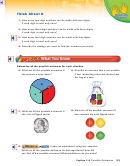 32
32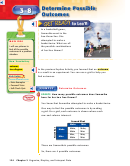 33
33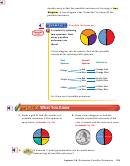 34
34 35
35 36
36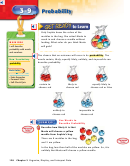 37
37 38
38 39
39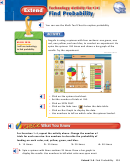 40
40 41
41 42
42 43
43 44
44 45
45 46
46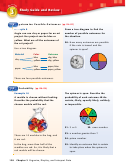 47
47 48
48 49
49 50
50Technology Activity for 3-9
Extend
Find Probability
You can use the Math Tool Chest to explore probability.
Angelo is using a spinner with four sections: one green, one
MAIN IDEA
red, one yellow, and one blue, to conduct an experiment. He
spins the spinner 100 times and draws a bar graph of the
I will use technology
to find probability.
results. Try the experiment.
C03-01SC-105733
•
Click on the spinner toolchest.
•
Set the number of trials at 100.
•
Click on SPIN FAST.
•
Click on the links icon (
) below the data table.
•
Click on Bar Graph to display the data.
•
Use numbers to tell on which color the spinner landed.
For Exercises 1–4, repeat the activity above. Change the number of
trials for each exercise. Use numbers to describe the probability of
landing on each color, red, yellow, green, and blue.
1. 15 times
2. 25 times
3. 30 times
4. 50 times
5. Spin a spinner with three sections 25 times. Draw a bar graph to
display the results. Use numbers to tell what color was spun most.
Extend 3-9 Find Probability 131
ADVERTISEMENT
0 votes
Related Articles
Related forms


 Worksheet - Chapter 3")


Related Categories
Parent category: Education