Profitability For Ots-Regulated Private-Sector Thrift Institutions Guide - Office Of Thrift Supervision - U.s. Department Of Treasury - 1998 Page 10
ADVERTISEMENT
 1
1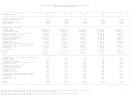 2
2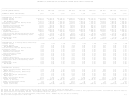 3
3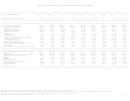 4
4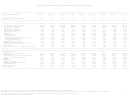 5
5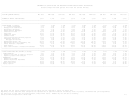 6
6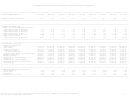 7
7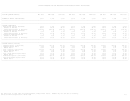 8
8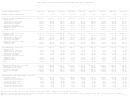 9
9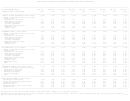 10
10 11
11 12
12 13
13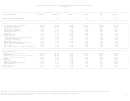 14
14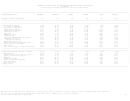 15
15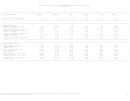 16
16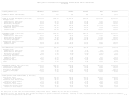 17
17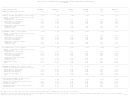 18
18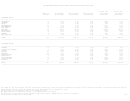 19
19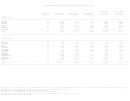 20
20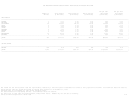 21
21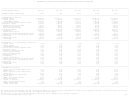 22
22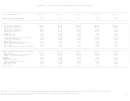 23
23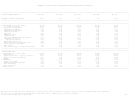 24
24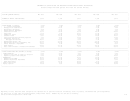 25
25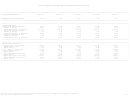 26
26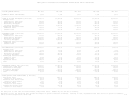 27
27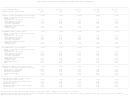 28
28 29
29 30
30ASSET QUALITY INDICATORS FOR OTS-REGULATED PRIVATE-SECTOR THRIFT INSTITUTIONS
___________________________________________________________________________________________________________________________________________________________________________
|
|
| FOR THE QUARTER ENDING:
DEC 1995
MAR 1996
JUN 1996
SEP 1996
DEC 1996
MAR 1997
JUN 1997
SEP 1997
DEC 1997
|
|
|
| NUMBER OF THRIFT INSTITUTIONS:
1,437
1,416
1,397
1,378
1,334
1,301
1,272
1,238
1,215
|
|___________________________________________________________________________________________________________________________________________________________________________|
|
|
| LOANS 30-89 DAYS DELINQUENT (% Total Assets)
0.89%
0.87%
0.83%
0.86%
0.88%
0.85%
0.78%
0.79%
0.81% |
|
Percent of Outstanding Loans by Loan Type:
|
|
Mortgage Loans
|
|
Construction & Land Loans
1.17
1.20
0.97
1.02
1.11
1.75
1.62
1.55
1.48
|
|
Nonresidential Mortgages
1.10
1.22
1.05
1.09
1.15
1.07
0.94
0.81
1.10
|
|
Multifamily Mortgages
0.84
0.71
0.57
0.58
0.58
0.55
0.42
0.39
0.40
|
|
1-4 Family Mortgages
1.40
1.35
1.29
1.30
1.29
1.24
1.15
1.14
1.13
|
|
Nonmortgage Loans and Leases
|
|
Commercial Loans
1.37
1.24
1.29
1.06
1.31
1.35
1.35
1.33
1.43
|
|
Consumer Loans
1.78
1.64
1.69
1.86
2.00
1.80
1.72
1.98
2.10
|
|___________________________________________________________________________________________________________________________________________________________________________|
|
|
| NONCURRENT LOANS (% Total Assets)
0.88%
0.92%
0.86%
0.87%
0.85%
0.88%
0.81%
0.83%
0.77% |
|
Percent of Outstanding Loans by Loan Type:
|
|
Mortgage Loans
|
|
Construction & Land Loans
1.33
1.24
1.03
0.97
0.92
1.34
1.12
1.10
1.23
|
|
Nonresidential Mortgages
2.03
2.07
1.80
1.88
1.69
1.75
1.66
1.80
1.62
|
|
Multifamily Mortgages
1.62
1.55
1.44
1.49
1.45
1.34
1.15
0.88
0.79
|
|
1-4 Family Mortgages
1.28
1.35
1.25
1.24
1.21
1.26
1.16
1.20
1.11
|
|
Nonmortgage Loans and Leases
|
|
Commercial Loans
1.43
1.29
1.64
1.64
1.38
1.31
1.39
1.23
1.10
|
|
Consumer Loans
0.76
0.80
0.80
0.86
0.89
0.95
0.90
0.91
0.97
|
|___________________________________________________________________________________________________________________________________________________________________________|
|
|
| NET CHARGE-OFFS (% Total Assets)
0.07%
0.07%
0.07%
0.07%
0.08%
0.05%
0.06%
0.07%
0.06% |
|
Percent of Outstanding Loans by Loan Type:
|
|
Mortgage Loans
|
|
Construction & Land Loans
0.08
0.02
0.03
0.02
0.03
0.03
0.03
0.01
0.06
|
|
Nonresidential Mortgages
0.09
0.10
0.12
0.08
0.09
0.04
0.03
0.05
-0.04
|
|
Multifamily Mortgages
0.16
0.15
0.13
0.15
0.10
0.06
0.08
0.04
0.01
|
|
1-4 Family Mortgages
0.05
0.05
0.05
0.05
0.06
0.03
0.04
0.05
0.03
|
|
Nonmortgage Loans and Leases
|
|
Commercial Loans
0.19
0.05
0.08
0.06
0.11
0.06
0.09
0.09
0.13
|
|
Consumer Loans
0.29
0.31
0.34
0.32
0.39
0.45
0.44
0.41
0.50
|
|
Repossessed Assets
4.57
3.92
3.33
3.25
3.31
2.21
2.23
2.05
2.38
|
|
Other
0.11
0.06
0.13
0.19
0.15
-0.02
0.11
0.13
0.25
|
|___________________________________________________________________________________________________________________________________________________________________________|
|
|
| REPOSSESSED ASSETS, NET (% Total Assets)
0.33%
0.32%
0.32%
0.29%
0.28%
0.27%
0.25%
0.25%
0.23% |
|
Percent of Outstanding Loans by Loan Type:
|
|
Construction & Land Loans
2.83
2.56
2.31
1.98
1.93
1.99
1.77
1.55
1.30
|
|
Nonresidential Mortgages
1.47
1.43
1.35
1.21
1.12
0.96
0.98
0.90
0.86
|
|
Multifamily Mortgages
1.04
0.84
0.84
0.66
0.56
0.55
0.59
0.61
0.50
|
|
1-4 Family Mortgages
0.34
0.35
0.35
0.34
0.32
0.30
0.28
0.28
0.27
|
|
Other
0.10
0.11
0.12
0.16
0.20
0.16
0.12
0.14
0.19
|
|___________________________________________________________________________________________________________________________________________________________________________|
|
|
| ASSET QUALITY SUMMARY (% Total Assets)
|
|
Net Chargeoffs (Annualized)
0.30%
0.27%
0.29%
0.28%
0.31%
0.20%
0.25%
0.27%
0.24% |
|
Net Provisions for Losses (Annualized)
0.27
0.23
0.23
0.26
0.37
0.25
0.26
0.26
0.26
|
|
Valuation Allowances
0.77
0.76
0.77
0.76
0.78
0.78
0.77
0.79
0.78
|
|
Noncurrent Loans
0.88
0.92
0.86
0.87
0.85
0.88
0.81
0.83
0.77
|
|
Repossessed Assets, Net (% Total Assets)
0.33
0.32
0.32
0.29
0.28
0.27
0.25
0.25
0.23
|
|
Troubled Assets
1.20
1.24
1.18
1.17
1.13
1.15
1.06
1.08
1.00
|
|___________________________________________________________________________________________________________________________________________________________________________|
All data prior to June 1996 are unconsolidated, except where noted.
Numbers may not sum due to rounding.
Beginning in 1997, net charge-off data include net changes in specific valuation allowances.
Starting in 1997, repossessed asset data are net of specific allowances.
Office of Thrift Supervision / March 1998
T-10
ADVERTISEMENT
0 votes
Related Articles
Related forms
 Fourth Quarter 1999 Index Of Charts - Office Of Thrift Supervision - U.s. Department Of Treasury
Legal
Fourth Quarter 1999 Index Of Charts - Office Of Thrift Supervision - U.s. Department Of Treasury
Legal
 U.s. Department Of Justice Form Eoir-29 - Notice Of Appeal To The Board Of Immigration - Appeals From A Decision Of A Uscis Officer
Legal
U.s. Department Of Justice Form Eoir-29 - Notice Of Appeal To The Board Of Immigration - Appeals From A Decision Of A Uscis Officer
Legal


 G-20: Fact Sheet On Imf Reform - Office Of The Press Secretary - The White House - U.s. Department Of The Treasury - 2010
Legal
G-20: Fact Sheet On Imf Reform - Office Of The Press Secretary - The White House - U.s. Department Of The Treasury - 2010
Legal
 Ref Cpi And Index Ratios For January 2000 - Treasury Inflation-indexed Securities - U.s. Department Of The Treasury, Bureau Of The Fiscal Service
Legal
Ref Cpi And Index Ratios For January 2000 - Treasury Inflation-indexed Securities - U.s. Department Of The Treasury, Bureau Of The Fiscal Service
Legal
 - Treasury Inspector General For Tax Administration - U.s. Department Of The Treasury") Form 5230 - Advisement Of Rights (non-custodial) - Treasury Inspector General For Tax Administration - U.s. Department Of The Treasury
Legal
Form 5230 - Advisement Of Rights (non-custodial) - Treasury Inspector General For Tax Administration - U.s. Department Of The Treasury
Legal


Related Categories
Parent category: Legal