Profitability For Ots-Regulated Private-Sector Thrift Institutions Guide - Office Of Thrift Supervision - U.s. Department Of Treasury - 1998 Page 9
ADVERTISEMENT
 1
1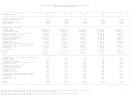 2
2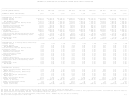 3
3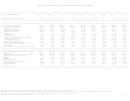 4
4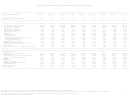 5
5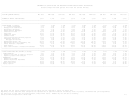 6
6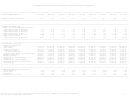 7
7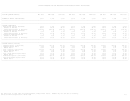 8
8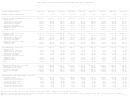 9
9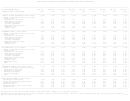 10
10 11
11 12
12 13
13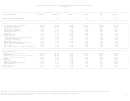 14
14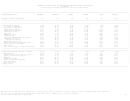 15
15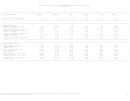 16
16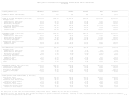 17
17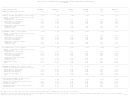 18
18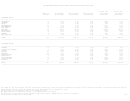 19
19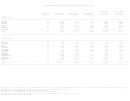 20
20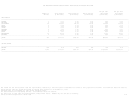 21
21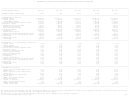 22
22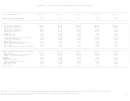 23
23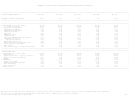 24
24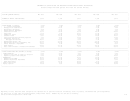 25
25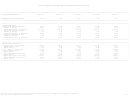 26
26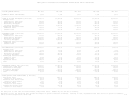 27
27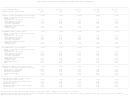 28
28 29
29 30
30ASSET QUALITY INDICATORS FOR OTS-REGULATED PRIVATE-SECTOR THRIFT INSTITUTIONS
___________________________________________________________________________________________________________________________________________________________________________
|
|
| FOR THE QUARTER ENDING:
DEC 1995
MAR 1996
JUN 1996
SEP 1996
DEC 1996
MAR 1997
JUN 1997
SEP 1997
DEC 1997
|
|
|
| NUMBER OF THRIFT INSTITUTIONS:
1,437
1,416
1,397
1,378
1,334
1,301
1,272
1,238
1,215
|
|___________________________________________________________________________________________________________________________________________________________________________|
|
|
| LOANS 30-89 DAYS DELINQUENT ($ Millions)
$6,853.18
$6,635.57
$6,374.04
$6,718.66
$6,759.29
$6,481.54
$5,976.31
$6,060.46
$6,267.91
|
|
Mortgage Loans
|
|
Construction & Land Loans
212.90
226.69
199.55
220.56
237.75
246.88
236.66
229.90
219.70
|
|
Nonresidential Mortgages
361.45
391.36
345.77
360.16
373.79
340.98
296.30
240.29
331.91
|
|
Multifamily Mortgages
407.50
343.51
278.52
282.42
280.63
265.45
200.51
184.28
191.91
|
|
1-4 Family Mortgages
5,100.40
4,959.64
4,797.26
5,003.15
4,947.83
4,759.05
4,414.55
4,406.71
4,420.06
|
|
Nonmortgage Loans and Leases
|
|
Commercial Loans
98.79
100.54
107.46
96.94
123.02
130.15
134.50
140.90
164.40
|
|
Consumer Loans
672.15
613.83
645.49
755.43
796.27
739.03
693.81
858.39
939.93
|
|___________________________________________________________________________________________________________________________________________________________________________|
|
|
| NONCURRENT LOANS ($ Millions)
$6,755.66
$7,015.27
$6,601.00
$6,802.69
$6,572.15
$6,739.10
$6,204.24
$6,302.18
$5,947.07
|
|
Mortgage Loans
|
|
Construction & Land Loans
241.67
234.27
212.70
209.50
197.19
188.34
163.50
162.54
182.14
|
|
Nonresidential Mortgages
666.09
667.06
591.85
618.14
551.09
556.99
521.06
537.42
489.44
|
|
Multifamily Mortgages
788.17
745.72
699.52
732.15
706.15
640.18
543.97
416.53
375.91
|
|
1-4 Family Mortgages
4,668.98
4,964.21
4,653.00
4,745.35
4,631.84
4,836.14
4,476.12
4,660.63
4,336.78
|
|
Nonmortgage Loans and Leases
|
|
Commercial Loans
103.18
104.59
137.35
150.00
130.04
126.65
138.59
131.08
126.04
|
|
Consumer Loans
287.57
299.43
306.59
347.56
355.84
390.81
361.01
393.97
436.77
|
|___________________________________________________________________________________________________________________________________________________________________________|
|
|
| NET CHARGE-OFFS ($ Millions)
$574.36
$512.07
$558.84
$548.30
$594.81
$388.03
$486.06
$510.28
$461.18
|
|
Mortgage Loans
|
|
Construction & Land Loans
15.22
3.88
6.14
3.51
7.44
4.61
4.66
1.10
8.49
|
|
Nonresidential Mortgages
30.81
32.95
40.21
25.12
28.74
13.99
8.03
13.53
(11.14) |
|
Multifamily Mortgages
78.50
72.43
62.88
71.48
47.11
29.81
37.20
17.27
2.55
|
|
1-4 Family Mortgages
179.30
172.12
193.28
181.90
230.99
110.32
172.43
212.19
99.66
|
|
Nonmortgage Loans and Leases
|
|
Commercial Loans
14.03
4.00
6.60
5.53
10.33
5.84
9.47
9.98
14.75
|
|
Consumer Loans
108.04
114.66
130.03
130.18
155.34
185.48
177.79
177.51
223.44
|
|
Repossessed Assets
114.63
94.89
81.05
73.96
70.80
44.83
43.38
38.98
43.22
|
|
Other
33.85
17.13
38.66
56.63
44.04
(6.84)
33.10
39.73
80.21
|
|___________________________________________________________________________________________________________________________________________________________________________|
|
|
| REPOSSESSED ASSETS, NET ($ Millions)
$2,505.93
$2,422.38
$2,431.11
$2,276.91
$2,137.81
$2,030.80
$1,944.73
$1,899.62
$1,814.56
|
|
Construction & Land Loans
516.40
482.48
476.42
429.97
411.99
280.90
259.59
230.42
192.28
|
|
Nonresidential Mortgages
482.83
461.63
443.20
397.71
366.87
304.49
308.48
269.26
259.43
|
|
Multifamily Mortgages
505.90
405.99
409.46
324.07
271.08
263.60
280.58
291.86
238.76
|
|
1-4 Family Mortgages
1,248.65
1,280.64
1,302.17
1,288.97
1,230.22
1,136.74
1,059.65
1,067.45
1,062.30
|
|
Other
29.28
35.21
34.51
47.17
58.42
45.06
36.43
40.64
61.80
|
|___________________________________________________________________________________________________________________________________________________________________________|
|
|
| ASSET QUALITY: REAL ESTATE LOANS ($ Billions)
|
|
Real Estate Loans
$465.14
$466.36
$474.76
$487.07
$486.64
$476.91
$478.81
$479.97
$483.29
|
|
Percent of Total Assets
60.33
61.13
61.80
62.62
63.25
62.37
62.27
62.92
62.23
|
|
Noncurrent Real Estate Loans
$6.36
$6.61
$6.16
$6.31
$6.09
$6.22
$5.70
$5.78
$5.38
|
|
Percent of Total Assets
0.83
0.87
0.80
0.81
0.79
0.81
0.74
0.76
0.69
|
|
Real Estate Owned
$2.75
$2.63
$2.63
$2.44
$2.28
$1.99
$1.91
$1.86
$1.75
|
|
Percent of Total Assets
0.36
0.34
0.34
0.31
0.30
0.26
0.25
0.24
0.23
|
|
Troubled Real Estate Loans
$9.12
$9.24
$8.79
$8.75
$8.37
$8.21
$7.61
$7.64
$7.14
|
|
Percent of Total Assets
1.18
1.21
1.14
1.12
1.09
1.07
0.99
1.00
0.92
|
|___________________________________________________________________________________________________________________________________________________________________________|
All data prior to June 1996 are unconsolidated, except where noted.
Numbers may not sum due to rounding.
Beginning in 1997, net charge-off data include net changes in specific valuation allowances.
Starting in 1997, repossessed asset data are net of specific allowances.
Office of Thrift Supervision / March 1998
T-9
ADVERTISEMENT
0 votes
Related Articles
Related forms
 Fourth Quarter 1999 Index Of Charts - Office Of Thrift Supervision - U.s. Department Of Treasury
Legal
Fourth Quarter 1999 Index Of Charts - Office Of Thrift Supervision - U.s. Department Of Treasury
Legal
 U.s. Department Of Justice Form Eoir-29 - Notice Of Appeal To The Board Of Immigration - Appeals From A Decision Of A Uscis Officer
Legal
U.s. Department Of Justice Form Eoir-29 - Notice Of Appeal To The Board Of Immigration - Appeals From A Decision Of A Uscis Officer
Legal


 G-20: Fact Sheet On Imf Reform - Office Of The Press Secretary - The White House - U.s. Department Of The Treasury - 2010
Legal
G-20: Fact Sheet On Imf Reform - Office Of The Press Secretary - The White House - U.s. Department Of The Treasury - 2010
Legal
 Ref Cpi And Index Ratios For January 2000 - Treasury Inflation-indexed Securities - U.s. Department Of The Treasury, Bureau Of The Fiscal Service
Legal
Ref Cpi And Index Ratios For January 2000 - Treasury Inflation-indexed Securities - U.s. Department Of The Treasury, Bureau Of The Fiscal Service
Legal
 - Treasury Inspector General For Tax Administration - U.s. Department Of The Treasury") Form 5230 - Advisement Of Rights (non-custodial) - Treasury Inspector General For Tax Administration - U.s. Department Of The Treasury
Legal
Form 5230 - Advisement Of Rights (non-custodial) - Treasury Inspector General For Tax Administration - U.s. Department Of The Treasury
Legal


Related Categories
Parent category: Legal