Profitability For Ots-Regulated Private-Sector Thrift Institutions Guide - Office Of Thrift Supervision - U.s. Department Of Treasury - 1998 Page 8
ADVERTISEMENT
 1
1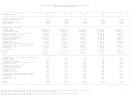 2
2 3
3 4
4 5
5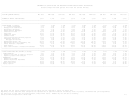 6
6 7
7 8
8 9
9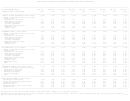 10
10 11
11 12
12 13
13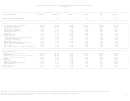 14
14 15
15 16
16 17
17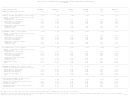 18
18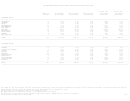 19
19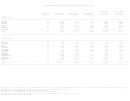 20
20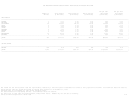 21
21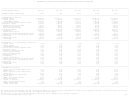 22
22 23
23 24
24 25
25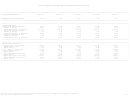 26
26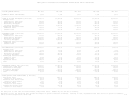 27
27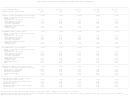 28
28 29
29 30
30CAPITAL MEASURES FOR OTS-REGULATED PRIVATE-SECTOR THRIFT INSTITUTIONS
___________________________________________________________________________________________________________________________________________________________________________
|
|
| FOR THE QUARTER ENDING:
DEC 1995
MAR 1996
JUN 1996
SEP 1996
DEC 1996
MAR 1997
JUN 1997
SEP 1997
DEC 1997
|
|
|
|
|
| NUMBER OF THRIFT INSTITUTIONS:
1,437
1,416
1,397
1,378
1,334
1,301
1,272
1,238
1,215
|
|___________________________________________________________________________________________________________________________________________________________________________|
___________________________________________________________________________________________________________________________________________________________________________
|
|
| CAPITAL COMPLIANCE
|
|
Meet FDICIA Capital Standards
1,430
1,411
1,391
1,374
1,333
1,298
1,269
1,235
1,214
|
|
Percent of Thrifts
99.51
99.65
99.57
99.71
99.93
99.77
99.76
99.76
99.92
|
|
Consolidated Assets ($ Billions)
$770.85
$763.38
$767.76
$777.03
$769.35
$764.33
$768.75
$762.71
$776.62
|
|
Fail FDICIA Capital Standards
5
5
6
4
1
3
3
3
1
|
|
Percent of Thrifts
0.35
0.35
0.43
0.29
0.07
0.23
0.24
0.24
0.08
|
|
Consolidated Assets ($ Billions)
$0.67
$0.78
$0.43
$0.75
$0.01
$0.27
$0.24
$0.09
$0.01
|
|
Critically Undercapitalized
0
0
1
1
0
1
1
0
0
|
|
Percent of Thrifts
0.00
0.00
0.07
0.07
0.00
0.08
0.08
0.00
0.00
|
|
Consolidated Assets ($ Billions)
$0.00
$0.00
$0.03
$0.02
$0.00
$0.01
$0.21
$0.00
$0.00
|
|___________________________________________________________________________________________________________________________________________________________________________|
___________________________________________________________________________________________________________________________________________________________________________
|
|
| CAPITAL RATIOS (Percent)
|
|
Tangible Equity ($ Billions)
$57.00
$57.12
$57.78
$56.57
$56.45
$56.40
$56.67
$56.53
$58.27
|
|
Tangible Equity Ratio
7.44
7.52
7.54
7.29
7.36
7.43
7.44
7.48
7.58
|
|
Median Ratio
8.82
8.81
8.92
8.63
8.80
8.83
8.93
9.17
9.22
|
|
Tier 1 Capital ($ Billions)
$57.22
$57.33
$57.98
$56.74
$56.61
$56.54
$56.81
$56.66
$58.36
|
|
Tier 1 Leverage Ratio
7.47
7.55
7.56
7.31
7.38
7.44
7.45
7.50
7.59
|
|
Median Ratio
8.81
8.80
8.92
8.61
8.80
8.83
8.93
9.17
9.22
|
|
Tier 1 Risk-based Capital Ratio
13.70
13.77
13.75
13.20
13.15
13.09
13.19
13.07
13.18
|
|
Median Ratio
17.65
17.69
17.70
16.95
17.35
17.26
17.45
17.78
17.83
|
|
Risk-based Capital ($ Billions)
$63.29
$63.17
$63.81
$62.69
$62.57
$62.54
$62.63
$62.81
$64.57
|
|
Total Risk-based Capital Ratio
15.15
15.17
15.14
14.58
14.53
14.48
14.54
14.49
14.59
|
|
Median Ratio
18.48
18.46
18.52
17.69
18.12
17.99
18.10
18.52
18.62
|
|___________________________________________________________________________________________________________________________________________________________________________|
All data prior to June 1996 are unconsolidated, except where noted.
Numbers may not sum due to rounding.
Office of Thrift Supervision / March 1998
T-8
ADVERTISEMENT
0 votes
Related Articles
Related forms
 Fourth Quarter 1999 Index Of Charts - Office Of Thrift Supervision - U.s. Department Of Treasury
Legal
Fourth Quarter 1999 Index Of Charts - Office Of Thrift Supervision - U.s. Department Of Treasury
Legal
 U.s. Department Of Justice Form Eoir-29 - Notice Of Appeal To The Board Of Immigration - Appeals From A Decision Of A Uscis Officer
Legal
U.s. Department Of Justice Form Eoir-29 - Notice Of Appeal To The Board Of Immigration - Appeals From A Decision Of A Uscis Officer
Legal


 G-20: Fact Sheet On Imf Reform - Office Of The Press Secretary - The White House - U.s. Department Of The Treasury - 2010
Legal
G-20: Fact Sheet On Imf Reform - Office Of The Press Secretary - The White House - U.s. Department Of The Treasury - 2010
Legal
 Ref Cpi And Index Ratios For January 2000 - Treasury Inflation-indexed Securities - U.s. Department Of The Treasury, Bureau Of The Fiscal Service
Legal
Ref Cpi And Index Ratios For January 2000 - Treasury Inflation-indexed Securities - U.s. Department Of The Treasury, Bureau Of The Fiscal Service
Legal
 - Treasury Inspector General For Tax Administration - U.s. Department Of The Treasury") Form 5230 - Advisement Of Rights (non-custodial) - Treasury Inspector General For Tax Administration - U.s. Department Of The Treasury
Legal
Form 5230 - Advisement Of Rights (non-custodial) - Treasury Inspector General For Tax Administration - U.s. Department Of The Treasury
Legal


Related Categories
Parent category: Legal