Profitability For Ots-Regulated Private-Sector Thrift Institutions Guide - Office Of Thrift Supervision - U.s. Department Of Treasury - 1998 Page 22
ADVERTISEMENT
 1
1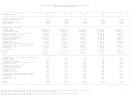 2
2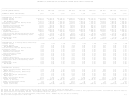 3
3 4
4 5
5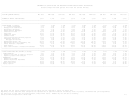 6
6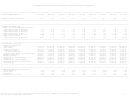 7
7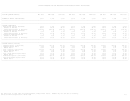 8
8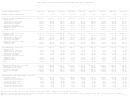 9
9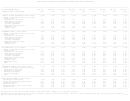 10
10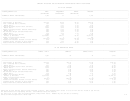 11
11 12
12 13
13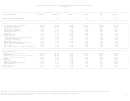 14
14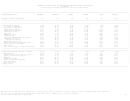 15
15 16
16 17
17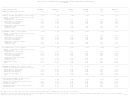 18
18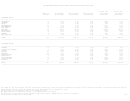 19
19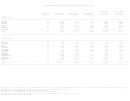 20
20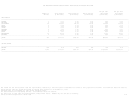 21
21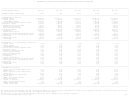 22
22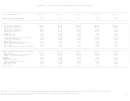 23
23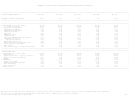 24
24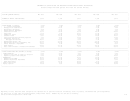 25
25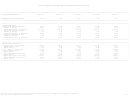 26
26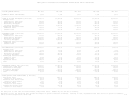 27
27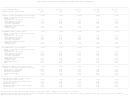 28
28 29
29 30
30STATEMENT OF OPERATIONS FOR OTS-REGULATED PRIVATE-SECTOR THRIFT INSTITUTIONS
___________________________________________________________________________________________________________________________________________________________________________
|
|
| FOR THE QUARTER ENDING:
DEC 1993
DEC 1994
DEC 1995
DEC 1996
DEC 1997
|
|
|
| NUMBER OF THRIFT INSTITUTIONS:
1,669
1,543
1,437
1,334
1,215
|
|___________________________________________________________________________________________________________________________________________________________________________|
|
|
| PROFITABILITY ($ Millions)
|
| Interest Income
$12,482.02
$12,904.53
$13,935.75
$13,843.65
$14,069.21
|
| Interest Expense
6,787.33
7,601.54
8,738.60
8,384.50
8,610.61
|
|
NET INTEREST INCOME
5,694.69
5,302.99
5,197.15
5,459.15
5,458.60
|
| Loss Provisions-Interest Bearing Assets
819.57
503.71
515.15
704.88
504.83
|
| Noninterest Income
1,754.88
1,335.01
1,311.23
1,768.68
2,138.82
|
|
Mortgage Loan Servicing Fees
112.27
186.20
177.61
230.15
226.00
|
|
Other Fees and Charges
558.08
497.03
561.45
750.98
972.16
|
|
Other Noninterest Income
1,084.53
651.78
572.17
787.56
940.66
|
| Noninterest Expense
4,725.01
4,471.30
4,098.51
4,394.82
4,406.01
|
|
G&A Expense
4,331.06
4,119.81
3,849.51
4,205.91
4,208.06
|
|
Goodwill Amortization
173.25
278.01
186.26
130.75
147.84
|
|
Loss Provisions-Noninterest Bearing Assets
220.70
73.48
62.74
58.17
50.10
|
| Income Before Taxes & Extraordinary Items
1,904.98
1,663.00
1,894.72
2,128.13
2,686.58
|
| Income Taxes
745.27
609.85
550.99
660.48
986.96
|
| Extraordinary Items
(84.97)
(4.50)
(81.03)
0.61
(1.50)
|
|
NET INCOME
1,074.74
1,048.65
1,262.69
1,468.25
1,698.13
|
|___________________________________________________________________________________________________________________________________________________________________________|
|
|
| PROFITABILITY (% of Average Assets Annualized)
|
| Interest Income
6.47%
6.73%
7.28%
7.23%
7.34%
|
| Interest Expense
3.52
3.97
4.56
4.38
4.49
|
|
NET INTEREST INCOME
2.95
2.77
2.71
2.85
2.85
|
| Loss Provisions-Interest Bearing Assets
0.42
0.26
0.27
0.37
0.26
|
| Noninterest Income
0.91
0.70
0.68
0.92
1.12
|
|
Mortgage Loan Servicing Fees
0.06
0.10
0.09
0.12
0.12
|
|
Other Fees and Charges
0.29
0.26
0.29
0.39
0.51
|
|
Other Noninterest Income
0.56
0.34
0.30
0.41
0.49
|
| Noninterest Expense
2.45
2.33
2.14
2.29
2.30
|
|
G&A Expense
2.24
2.15
2.01
2.20
2.19
|
|
Goodwill Amortization
0.09
0.15
0.10
0.07
0.08
|
|
Loss Provisions-Noninterest Bearing Assets
0.11
0.04
0.03
0.03
0.03
|
| Income Before Taxes & Extraordinary Items
0.99
0.87
0.99
1.11
1.40
|
| Income Taxes
0.39
0.32
0.29
0.34
0.51
|
| Extraordinary Items
-0.04
0.00
-0.04
0.00
0.00
|
|
NET INCOME
0.56
0.55
0.66
0.77
0.89
|
|___________________________________________________________________________________________________________________________________________________________________________|
|
|
| PROFITABILITY (Percent)
|
|
Return on Average Assets (Annualized)
0.56
0.55
0.66
0.77
0.89
|
|
Median Ratio
0.91
0.79
0.73
0.83
0.79
|
|
Return on Average Equity (Annualized)
7.44
7.24
8.31
9.75
10.74
|
|
Median Ratio
10.64
8.58
7.28
8.48
7.70
|
|
Net Interest Margin (Annualized)
2.95
2.77
2.71
2.85
2.85
|
|
Median Ratio
3.40
3.36
3.10
3.21
3.18
|
|
Number of Profitable Thrifts
1,537
1,393
1,304
1,235
1,111
|
|
Percent Profitable
92.09
90.28
90.74
92.58
91.44
|
|
Profits ($ Millions)
$1,588.93
$1,456.03
$1,537.07
$1,650.07
$1,811.03
|
|
Number of Unprofitable Thrifts
132
150
133
99
104
|
|
Percent Unprofitable
7.91
9.72
9.26
7.42
8.56
|
|
Losses ($ Millions)
($514.18)
($407.38)
($274.38)
($181.82)
($112.91)
|
|___________________________________________________________________________________________________________________________________________________________________________|
Net income for the third quarter 1996 was significantly reduced by a one-time special assessment fee levied to fully capitalize the SAIF.
See Technical Notes for details.
All data exclude self-liquidating thrifts.
See Technical Notes for details.
All data prior to June 1996 are unconsolidated, except where noted.
Numbers may not sum due to rounding.
Office of Thrift Supervision / March 1998
T-22
ADVERTISEMENT
0 votes
Related Articles
Related forms
 Fourth Quarter 1999 Index Of Charts - Office Of Thrift Supervision - U.s. Department Of Treasury
Legal
Fourth Quarter 1999 Index Of Charts - Office Of Thrift Supervision - U.s. Department Of Treasury
Legal
 U.s. Department Of Justice Form Eoir-29 - Notice Of Appeal To The Board Of Immigration - Appeals From A Decision Of A Uscis Officer
Legal
U.s. Department Of Justice Form Eoir-29 - Notice Of Appeal To The Board Of Immigration - Appeals From A Decision Of A Uscis Officer
Legal


 G-20: Fact Sheet On Imf Reform - Office Of The Press Secretary - The White House - U.s. Department Of The Treasury - 2010
Legal
G-20: Fact Sheet On Imf Reform - Office Of The Press Secretary - The White House - U.s. Department Of The Treasury - 2010
Legal
 Ref Cpi And Index Ratios For January 2000 - Treasury Inflation-indexed Securities - U.s. Department Of The Treasury, Bureau Of The Fiscal Service
Legal
Ref Cpi And Index Ratios For January 2000 - Treasury Inflation-indexed Securities - U.s. Department Of The Treasury, Bureau Of The Fiscal Service
Legal
 - Treasury Inspector General For Tax Administration - U.s. Department Of The Treasury") Form 5230 - Advisement Of Rights (non-custodial) - Treasury Inspector General For Tax Administration - U.s. Department Of The Treasury
Legal
Form 5230 - Advisement Of Rights (non-custodial) - Treasury Inspector General For Tax Administration - U.s. Department Of The Treasury
Legal


Related Categories
Parent category: Legal