Profitability For Ots-Regulated Private-Sector Thrift Institutions Guide - Office Of Thrift Supervision - U.s. Department Of Treasury - 1998 Page 14
ADVERTISEMENT
 1
1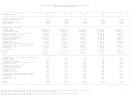 2
2 3
3 4
4 5
5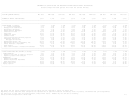 6
6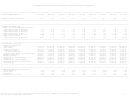 7
7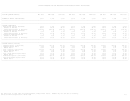 8
8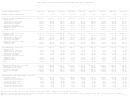 9
9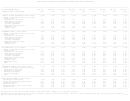 10
10 11
11 12
12 13
13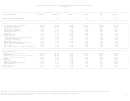 14
14 15
15 16
16 17
17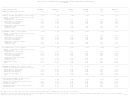 18
18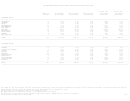 19
19 20
20 21
21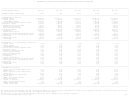 22
22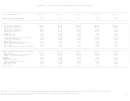 23
23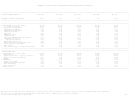 24
24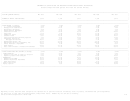 25
25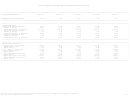 26
26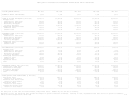 27
27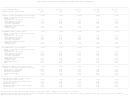 28
28 29
29 30
30STATEMENT OF CONDITION FOR OTS-REGULATED PRIVATE-SECTOR THRIFT INSTITUTIONS
BY REGION
___________________________________________________________________________________________________________________________________________________________________________
|
|
| FOURTH QUARTER 1997:
NORTHEAST
SOUTHEAST
CENTRAL
MIDWEST
WEST
INDUSTRY
|
|
|
|
|
| NUMBER OF THRIFT INSTITUTIONS:
257
237
363
256
102
1,215
|
|___________________________________________________________________________________________________________________________________________________________________________|
___________________________________________________________________________________________________________________________________________________________________________
|
|
| TOTAL ASSETS (% of Total Assets)
100.00%
100.00%
100.00%
100.00%
100.00%
100.00%
|
|
1 - 4 Family Mortgages
44.60
47.25
51.58
44.14
54.94
50.32
|
|
Mortgage Pool Securities
15.34
10.19
9.39
13.81
14.91
13.37
|
|
Multifamily Mortgages
4.00
1.37
3.64
2.49
10.42
6.11
|
|
Nonresidential Mortgages
4.72
5.76
3.33
3.92
3.38
3.89
|
|
Construction Loans
0.83
3.77
1.80
3.59
0.50
1.46
|
|
Land Loans
0.18
1.85
0.60
0.64
0.17
0.45
|
|
Commercial Loans
1.72
1.77
1.81
1.96
0.99
1.48
|
|
Consumer Loans
5.52
7.53
8.22
10.97
2.78
5.78
|
|
Cash and Noninterest-Earning Deposits
1.40
1.98
1.40
1.18
1.34
1.40
|
|
Investment Securities
17.08
13.46
13.21
11.72
6.06
10.95
|
|
Mortgage Derivatives
8.18
3.31
5.64
3.77
2.99
4.67
|
|
Repossessed Assets, Net
0.23
0.41
0.13
0.19
0.27
0.23
|
|
Real Estate Held for Investment, Net
0.06
0.09
0.09
0.04
0.05
0.06
|
|
Office Premises & Equipment
0.97
1.57
1.10
1.08
0.86
1.02
|
|
Other Assets
3.93
3.76
4.28
4.85
4.14
4.18
|
|
Less: Contra Assets & Valuation Allowances
0.59
0.76
0.58
0.59
0.82
0.69
|
|___________________________________________________________________________________________________________________________________________________________________________|
___________________________________________________________________________________________________________________________________________________________________________
|
|
| TOTAL LIABILITIES
|
|
AND CAPITAL (% of Total Assets)
100.00%
100.00%
100.00%
100.00%
100.00%
100.00%
|
|
TOTAL DEPOSITS
67.88
73.63
69.81
63.59
60.78
65.38
|
|
Deposits less than or equal to $100,000
58.99
62.06
59.45
54.60
49.25
54.91
|
|
Deposits greater than $100,000
8.89
11.57
10.36
8.99
11.53
10.48
|
|
Escrows
0.94
0.37
1.23
1.84
0.98
1.08
|
|
BORROWINGS
21.22
14.55
18.54
24.67
29.35
23.81
|
|
Advances From FHLB
13.62
11.52
13.48
16.31
17.41
15.26
|
|
Reverse Repurchase Agreements
5.83
1.77
3.63
5.15
5.78
4.96
|
|
Other Borrowings
1.78
1.26
1.43
3.20
6.16
3.59
|
|
Other Liabilities
1.21
1.61
1.28
1.14
1.61
1.41
|
|
Equity Capital
8.75
9.85
9.14
8.76
7.27
8.33
|
|___________________________________________________________________________________________________________________________________________________________________________|
Beginning in 1997, detailed asset categories are reported net of specific valuation allowances, loans in process, and unamortized yield adjustments.
All data prior to June 1996 are unconsolidated, except where noted.
Numbers may not sum due to rounding.
Office of Thrift Supervision / March 1998
T-14
ADVERTISEMENT
0 votes
Related Articles
Related forms
 Fourth Quarter 1999 Index Of Charts - Office Of Thrift Supervision - U.s. Department Of Treasury
Legal
Fourth Quarter 1999 Index Of Charts - Office Of Thrift Supervision - U.s. Department Of Treasury
Legal
 U.s. Department Of Justice Form Eoir-29 - Notice Of Appeal To The Board Of Immigration - Appeals From A Decision Of A Uscis Officer
Legal
U.s. Department Of Justice Form Eoir-29 - Notice Of Appeal To The Board Of Immigration - Appeals From A Decision Of A Uscis Officer
Legal


 G-20: Fact Sheet On Imf Reform - Office Of The Press Secretary - The White House - U.s. Department Of The Treasury - 2010
Legal
G-20: Fact Sheet On Imf Reform - Office Of The Press Secretary - The White House - U.s. Department Of The Treasury - 2010
Legal
 Ref Cpi And Index Ratios For January 2000 - Treasury Inflation-indexed Securities - U.s. Department Of The Treasury, Bureau Of The Fiscal Service
Legal
Ref Cpi And Index Ratios For January 2000 - Treasury Inflation-indexed Securities - U.s. Department Of The Treasury, Bureau Of The Fiscal Service
Legal
 - Treasury Inspector General For Tax Administration - U.s. Department Of The Treasury") Form 5230 - Advisement Of Rights (non-custodial) - Treasury Inspector General For Tax Administration - U.s. Department Of The Treasury
Legal
Form 5230 - Advisement Of Rights (non-custodial) - Treasury Inspector General For Tax Administration - U.s. Department Of The Treasury
Legal


Related Categories
Parent category: Legal