Disparities In Stem Employment By Sex, Race, And Hispanic Origin - American Community Survey Reports (U.s. Census Bureau) Page 16
ADVERTISEMENT
 Printable pdf") 1
1 2
2 3
3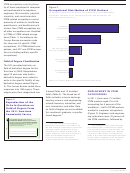 4
4 5
5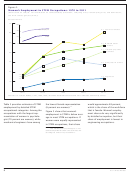 6
6 7
7 8
8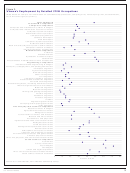 9
9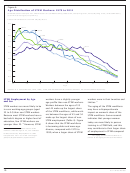 10
10 11
11 12
12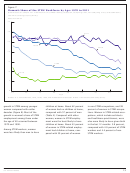 13
13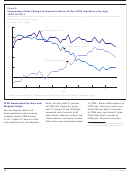 14
14 15
15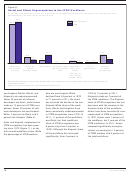 16
16 17
17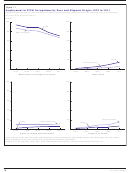 18
18 19
19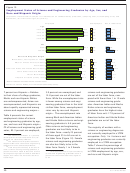 20
20 21
21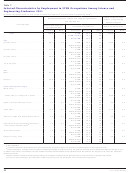 22
22 23
23 24
24 25
25Figure 9.
Racial and Ethnic Representation in the STEM Workforce
(In percent. Data based on sample. For information on con dentiality protection, sampling error, nonsampling error,
and de nitions, see www.census.gov/acs/www/)
70.8
Total workforce
66.9
STEM
14.5
14.9
10.8
6.5
6.4
5.5
4.6
1.9
1.8
1.4
0.6
0.4
White alone,
Black or
Asian alone
American Indian
Some Other
Two or
Hispanic
not Hispanic
African
and Alaska Native
Race and
More Races
or Latino
or Latino
American alone
alone
Native
(of any race)
Hawaiian or
Other Paci c
Islander alone
Note: Native Hawaiian or Other Paci c Islander alone was combined with Some Other Race because of a small number of
sample observations.
Source: U.S. Census Bureau, 2011 American Community Survey.
non-Hispanic Whites, Blacks, and
who are non-Hispanic White
1970 to 15 percent in 2011,
Hispanics are underrepresented.
declined from 94 percent in 1970
Hispanics made up 7 percent of
About 30 percent of software
to 71 percent in 2011, the share
the STEM workforce. The Hispanic
developers are Asian, while Asians
has mirrored the decline in the non-
share of STEM occupations has not
make up 15 percent of STEM occu-
Hispanic White share of the work-
kept pace with the increase in the
pations. About 59 percent of soft-
force. Blacks and Hispanics have
Hispanic share of the workforce.
ware developers are non-Hispanic
been consistently underrepresented
Asians have been consistently over-
White, 5 percent are Black, and 4
in STEM occupations since 1970. In
represented in STEM occupations.
percent are Hispanic (Table 3).
2011, 11 percent of the workforce
In 1970, Asians were 1 percent of
was Black, but their workforce
the workforce, but 2 percent of the
Asian and Hispanic employment in
share of STEM occupations was
STEM workforce. In 2011, Asians
STEM occupations has been grow-
6 percent (up from 2 percent in
remained significantly overrepre-
ing since 1970 (Figure 11), as has
1970). Although the Hispanic share
sented, accounting for 15 percent
their overall workforce share. While
of the workforce has increased
of STEM workers and 6 percent of
the percentage of STEM workers
significantly, from 3 percent in
the total workforce.
16
U.S. Census Bureau
ADVERTISEMENT
0 votes
Related Articles
Related forms

 Survey Methodology #2012-02 - New Relationship And Marital Questions: A Reflection Of Changes To The Social And Legal Recognition Of Same-sex Couples In The U.s. - U.s. Census Bureau
Legal
Survey Methodology #2012-02 - New Relationship And Marital Questions: A Reflection Of Changes To The Social And Legal Recognition Of Same-sex Couples In The U.s. - U.s. Census Bureau
Legal
 Survey Methodology #2006-02 - Use Of Dependent Interviewing Procedures To Improve Data Quality In The Measurement Of Change - U.s. Census Bureau
Legal
Survey Methodology #2006-02 - Use Of Dependent Interviewing Procedures To Improve Data Quality In The Measurement Of Change - U.s. Census Bureau
Legal

 - Consolidated Bas - U.s. Census Bureau")


 En Espanol: Using Cognitive Interviews To Test The Functional Equivalency Of Questionnaire Translations - U.s. Bureau Of The Census")


Related Categories
Parent category: Legal